Notes to the Financial Statements
1. Reporting Entity
1.1 Corporate Information
Commercial Bank of Ceylon PLC (the ‘Bank’) is a public limited liability company listed on the Colombo Stock Exchange, incorporated on June 25, 1969, (and domiciled) in Sri Lanka. It is a licensed commercial bank regulated under the Banking Act No. 30 of 1988 and amendments thereto. The Bank was re-registered under the Companies Act No. 07 of 2007. The registered office of the Bank is situated at ‘Commercial House’, No. 21, Sir Razik Fareed Mawatha, Colombo 01, Sri Lanka. The ordinary shares of the Bank have a primary listing on the Colombo Stock Exchange. For further information please refer inner back cover of this Annual Report.
The staff strength of the Bank as at December 31, 2013 was 4,730 (4,602 as at December 31, 2012).
1.2 Consolidated Financial Statements
The Consolidated Financial Statements as at and for the year ended December 31, 2013, comprise the Bank (Parent Company) and its Subsidiaries (together referred to as the ‘Group’ and individually as ‘Group entities’), and the Group’s interest in its Associates.
The Bank does not have an identifiable Parent of its own.
1.3 Principal Business Activities and Nature of Operations of the Bank, its Subsidiaries and Associates
| Entity | Principal Business Activities |
| Bank | The Bank provides a comprehensive range of financial services encompassing accepting deposits, personal banking, trade financing, off-shore banking, resident and non-resident foreign currency operations, travel-related services, corporate and retail credit, syndicated financing, project financing, development banking, lease financing, hire purchase financing, rural credit, issuing of local and international debit and credit cards, tele-banking facilities, internet banking, mobile banking, money remittance facilities, dealing in Government Securities and treasury-related products, salary remittance package, bullion trading, export and domestic factoring, pawning, margin trading, e-banking services, Bancassurance and Islamic banking products and services, etc. |
| Subsidiaries | |
| Commercial Development Company PLC | Property development and related ancillary services and outsourcing of staff for non-critical functions of the Bank. |
| ONEzero Company Ltd. | Providing IT-related services. |
| Commex Sri Lanka S.R.L. | Acting as an agent to the Bank and providing money transfer services, opening accounts, issuance and encashment of foreign currencies and Travellers’ Cheques and collecting applications for credit facilities. The commercial operations of this company are yet to be commenced. |
| Associates | |
| Equity Investments Lanka Ltd. | Fund management. |
| Commercial Insurance Brokers (Pvt) Ltd. | Insurance brokering. |
| There were no significant changes in the nature of the principal business activities of the Bank and the Group during the financial year under review. | |
2. Basis of Preparation
2.1 Statement of Compliance
The Consolidated Financial Statements of the Group and the separate Financial Statements of the Bank, have been prepared and presented in accordance with the Sri Lanka Accounting Standards (SLFRS) laid down by The Institute of Chartered Accountant of Sri Lanka and in compliance with the requirements of the Companies Act No. 07 of 2007 and the Banking Act No. 30 of 1988 and amendments thereto, and provide appropriate disclosures as required by the Listing Rules of the Colombo Stock Exchange. These SLFRS are available at www.casrilanka.com.
The Group and the Bank did not adopt any inappropriate accounting treatments which are not in compliance with the requirements of the SLFRSs, and regulations governing the preparation and presentation of the Financial Statements.
The formats used in the preparation of the Financial Statements and the disclosures made therein also comply with the specified format prescribed by the Central Bank of Sri Lanka for the Preparation, Presentation and Publication of Annual Audited Financial Statements of Licensed Commercial Banks.
2.2 Responsibility for Financial Statements
The Board of Directors is responsible for the preparation and presentation of the Financial Statements of the Group and the Bank as per the provisions of the Companies Act No. 07 of 2007 and SLFRS.
The Board of Directors acknowledges their responsibility as set out in the ‘Annual Report of the Board of Directors’, “Statement of Directors’ Responsibility” and the certification on the Statement of Financial Position.
These Financial Statements include the following components:
- an Income Statement and a Statement of Comprehensive Income providing the information on the financial performance of the Group and the Bank for the year under review;
- a Statement of Financial Position providing the information on the financial position of the Group and the Bank as at the year-end;
- a Statement of Changes in Equity depicting all changes in shareholders’ funds during the year under review of the Group and the Bank;
- a Statement of Cash Flows providing the information to the users, on the ability of the Group and the Bank to generate cash and cash equivalents and the needs of entities to utilise those cash flows; and
- Notes to the Financial Statements comprising Accounting Policies and other explanatory information set out below.
2.3 Approval of Financial Statements by the Board of Directors
The Financial Statements of the Group and the Bank for the year ended December 31, 2013 (including comparatives) were approved and authorised for issue by the Board of Directors on February 24, 2014.
2.4 Basis of Measurement
The Financial Statements of the Group and the Bank have been prepared on the historical cost basis except for the following material items in the Statement of Financial Position:
| Items | Measurement Basis | Note No./s |
| Held for Trading financial instruments | Fair value | 24 |
| Available-for-sale financial investments | Fair value | 27 |
| Land and Buildings | Stated at valuation | 30 |
| Net defined benefit (asset)/liability | Liability for defined benefit obligations is recognised as the present value of the defined benefit obligation less the net total of the plan assets, plus unrecognised actuarial gains, less unrecognised past service cost and unrecognised actuarial losses | 40 |
2.5 Functional and Presentation Currency
Items included in the Financial Statements of the Group and the Bank are measured using the currency of the primary economic environment in which the Bank operates (the functional currency). These Financial Statements are presented in Sri Lankan Rupees, the Group’s functional and presentation currency. Each entity in the Group determines its own functional currency and items included in the Financial Statements of these entities are measured using that functional currency. There was no change in the Group’s presentation and functional currency during the year under review.
The information presented in US Dollars in the Section on ‘Annexes’ does not form part of the Financial Statements and is solely for the information of stakeholders.
2.6 Presentation of Financial Statements
The assets and liabilities of the Group and the Bank presented in its Statement of Financial Position are grouped by nature and listed in an order that reflects their relative liquidity and maturity pattern. No adjustments have been made for inflationary factors affecting the Financial Statements. An analysis on recovery or settlement within 12 months after the Reporting date and more than 12 months after the Reporting date is presented in Note 50.
Financial assets and financial liabilities are offset and the net amount reported in the Consolidated Statement of Financial Position only when there is a legally enforceable right to offset the recognised amounts and there is an intention to settle on a net basis, or to realise the assets and settle the liability simultaneously. Income and expenses are not offset in the consolidated Statement of Comprehensive Income unless required or permitted by an Accounting Standard or interpretation, and as specifically disclosed in the Accounting Policies of the Bank.
2.7 Materiality and Aggregation
Each material class of similar items is presented separately in the Financial Statements. Items of dissimilar nature or function are presented separately unless they are immaterial as permitted by the Sri Lanka Accounting Standard - LKAS 1 on ‘Presentation of Financial Statements’.
2.8 Rounding
The amounts in the Financial Statements have been rounded-off to the nearest Rupees thousand, except where otherwise indicated as permitted by the Sri Lanka Accounting Standard - LKAS 1 on ‘Presentation of Financial Statements’.
2.9 Use of Judgments and Estimates
In preparing the Financial Statements of the Group and the Bank in conformity with SLFRSs the management has made judgments, estimates and assumptions that affect the application of Accounting Policies and the reported amounts of assets, liabilities, income and expenses. Actual results may differ from these estimates. Estimates and underlying assumptions are reviewed on an ongoing basis. Revisions to accounting estimates are recognised prospectively.
Information about significant areas of estimation, uncertainty and critical judgments in applying Accounting Policies that have most significant effect on the amounts recognised in the Financial Statements of the Group and the Bank are as follows:
2.9.1 Going Concern
The management has made an assessment of its ability to continue as a going concern and is satisfied that it has the resources to continue in business for the foreseeable future. Furthermore, management is not aware of any material uncertainties that may cast significant doubt upon the Group’s ability to continue as a going concern. Therefore, the Financial Statements continue to be prepared on a going concern basis.
2.9.2 Fair Value of Financial Instruments
The determination of fair values of financial assets and financial liabilities recorded on the Statement of Financial Position for which there is no observable market price are determined using a variety of valuation techniques that include the use of mathematical models. The valuation of financial instruments is described in more detail in Note 3.3.9.
The Bank measures fair value using the fair value hierarchy that reflects the significance of input used in making measurements, as described in Note 3.3.9.
2.9.3 Financial Assets and Liabilities Classification
The Bank’s Accounting Policies provide scope for assets and liabilities to be classified at inception into different accounting categories in certain circumstances.
- In classifying financial assets or liabilities at ‘Fair value through profit or loss’, and within that category as ‘Held-for-Trading’ the Bank has determined that it has met the criteria for this designation set out in Notes 3.3.3.1 and 3.3.9.
- In classifying financial assets as ‘Held-to-Maturity’, the Bank has determined that it has both the positive intention and ability to hold the assets until their maturity date as required by Note 3.3.3.5.
2.9.4 Impairment Losses on Loans and Advances
The Bank reviews its individually significant loans and advances at each Reporting date to assess whether an impairment loss should be provided for in the Statement of Comprehensive Income. In particular, management’s judgment is required in the estimation of the amount and timing of future cash flows when determining the impairment loss. These estimates are based on assumptions about a number of factors and actual results may differ, resulting in future changes to the provisions made.
The individual component of the total provision for impairment applies to financial assets evaluated individually for impairment and is based on management’s best estimate of the present value of the cash flows that are expected to be received. In estimating these cash flows, management makes judgments about a borrower’s financial situation and the net realisable value of any underlying collateral. Each impaired asset is assessed on its merits, and the workout strategy and estimate of cash flows considered recoverable. A collective component of the total provision is established for:
- groups of homogeneous loans that are not considered individually significant; and
- groups of assets that are individually significant but that were not found to be individually impaired
The collective provision for groups of homogeneous loans is established using statistical methods or, a formula approach based on historical loss rate experience, using the statistical analysis of historical data on delinquency to estimate the amount of loss. Management applies judgment to ensure that the estimate of loss arrived at on the basis of historical information is appropriately adjusted to reflect the economic conditions and product mix at the reporting date. The loss rates are regularly benchmarked against actual loss experience.
In assessing the need for collective loss provision, management considers factors such as credit quality (such as loan to collateral ratio, level of restructured performing loans etc.) portfolio size, concentrations and economic factors. To estimate the required provision, assumptions are made to define how inherent losses are modelled and to determine the required input parameters, based on historical experience and current economic conditions (including policy rates, inflation, growth in GDP, sovereign rating, etc.).
The accuracy of the provision depends on the model assumptions and parameters used in determining the collective provision.
The impairment loss on loans and advances is disclosed in more detail in Note 26.2.
2.9.5 Impairment Losses on Other Assets
The Group assesses whether there are any indicators of impairment for an asset or a cash-generating unit at each Reporting date or more frequently, if events or changes in circumstances necessitate to do so. This requires the estimation of the ‘value in use’ of such individual assets or the cash-generating units. Estimating value in use requires management to make an estimate of the expected future cash flows from the asset or the cash-generating unit and also to select a suitable discount rate in order to calculate the present value of the relevant cash flows. This valuation requires the Group to make estimates about expected future cash flows and discount rates, and hence, they are subject to uncertainty.
Specific Accounting Policies on impairment of assets are discussed in Notes 3.3.10 and 3.8.
2.9.6 Deferred Tax Assets
Deferred tax assets are recognised in respect of tax losses to the extent that it is probable that future taxable profit will be available against which such tax losses can be utilised. Judgment is required to determine the amount of deferred tax assets that can be recognised, based upon the likely timing and level of future taxable profits, together with future tax-planning strategies (Refer Note 5.2).
2.9.7 Defined Benefit Obligation
The cost of the defined benefit plans is determined using an actuarial valuation. The actuarial valuation involves making assumptions about discount rates, expected rates of return on assets, future salary increases, mortality rates and future pension increases. Due to the long term nature of these plans, such estimates are subject to significant uncertainty. Refer Note 51 for the assumptions used.
2.9.8 Provisions for Liabilities and Contingencies
The Group receives legal claims against it in the normal course of business. Management has made judgments as to the likelihood of any claim succeeding in making provisions. The time of concluding legal claims is uncertain, as is the amount of possible outflow of economic benefits. Timing and cost ultimately depend on the due process in respective legal jurisdictions.
Information about significant areas of estimation uncertainty and critical judgments in applying Accounting Policies other than those stated above that have significant effects on the amounts recognised in the Consolidated Financial Statements are described in Notes 3.14 and 3.15.
2.10 Events after the Reporting Period
Events after the Reporting Period are those events, favourable and unfavourable, that occur between the Reporting date and the date when the Financial Statements are authorised for issue.
In this regard, all material and important events that occurred after the Reporting Period have been considered and appropriate disclosures are made in Note 54 where necessary.
Significant Accounting Policies
The Accounting Policies set out below have been applied consistently to all periods presented in the Financial Statements of the Group and the Bank, unless otherwise indicated.
These Accounting Policies have been applied consistently by Group entities.
3. Significant Accounting Policies - Recognition of Assets and Liabilities
3.1 Basis of Consolidation
The Group’s Financial Statements comprise consolidation of the Financial Statements of the Bank, its Subsidiaries in terms of the Sri Lanka Accounting Standard - LKAS 27 on ‘Consolidated and Separate Financial Statements’ and the proportionate share of the profit or loss and net assets of its Associates in terms of the Sri Lanka Accounting Standard - LKAS 28 on ‘Investments in Associates’. The Bank’s Financial Statements comprise the amalgamation of the Financial Statements of the Domestic Banking Unit, the Off-Shore Banking Centre and the international operations of the Bank.
3.1.1 Business Combinations and Goodwill
Acquisitions on or after January 1, 2010
For acquisitions on or after January 1, 2010, the Group measures goodwill as the fair value of the consideration transferred including the recognised amount of any non-controlling interests in the acquiree, less the net recognised amount (generally fair value) of the identifiable assets acquired and liabilities assumed, all measured as of the acquisition date in terms of the Sri Lanka Accounting Standard - SLFRS 3 on ‘Business Combinations’.
The Group elects on a transaction-by-transaction basis whether to measure non-controlling interests at its fair value, or at its proportionate share of the recognised amount of the identifiable net assets, at the acquisition date.
Transaction costs, other than those associated with the issue of debt or equity securities, that the Group incurs in connection with a business combination are expensed as incurred.
The Sri Lanka Accounting Standard - SLFRS 3 on ‘Business Combinations’ requires that following the initial recognition, goodwill is to be measured at cost, less any accumulated impairment losses and goodwill to be reviewed for impairment, annually or more frequently if events or changes in circumstances indicate that the carrying value may be impaired.
However, acquired goodwill, if any, is written-off in full in the year of acquisition, since the Bank is not permitted to pay dividends otherwise, as per the Section 22 of the Banking Act No. 30 of 1988.
When the excess is negative, a gain from a bargain purchase is recognised immediately in profit or loss.
When Subsidiaries/Associates/Other Business Units are disposed off, the difference between the proceeds on disposal and the net assets plus cumulative translation differences which have been directly recognised in equity and unimpaired goodwill, if any, is recognised in the Statement of Comprehensive Income in the year of disposal.
Acquisitions prior to January 1, 2010
As part of its transition to SLFRSs, the Group elected to restate only those business combinations that occurred on or after January 1, 2010. In respect of acquisitions prior to January 1, 2010, goodwill represents the amount recognised under the Group’s previous accounting framework (i.e.; Sri Lanka Accounting Standards (SLASs) that were in force up to December 31, 2010).
No goodwill/gain from a bargain purchase arose from the treatment of Associates under the Equity Method since the Group had the respective percentages of ownership in Associates from the commencement of those Associates.
3.1.2 Subsidiaries
Subsidiaries are entities controlled by the Group. The Financial Statements of Subsidiaries are fully consolidated from the date on which control is transferred to the Bank and continue to be consolidated until the date when such control ceases. Control is achieved where the Bank has the power to govern the financial and operating policies of an entity so as to obtain benefits from its activities.
3.1.3 Non-Controlling Interests
Non-controlling interests represent the portion of profit or loss and net assets of Subsidiaries not owned, directly or indirectly, by the Bank.
Non-controlling interests are presented separately in the Consolidated Statement of Comprehensive Income and within equity in the Consolidated Statement of Financial Position, but separate from Parent shareholders’ equity. Any losses applicable to the non-controlling interests are allocated against the interests of the non-controlling interests even if this results in a deficit balance. Acquisitions of non-controlling interests are accounted for using the Parent entity extension method, whereby the difference between the consideration and the fair value of the share of the net assets acquired is recognised as equity. Therefore, no goodwill recognised as a result of such transactions.
The Financial Statements of the Bank’s Subsidiaries are prepared for the same reporting year, using consistent Accounting Policies.
The Financial Statements of all Subsidiaries in the Group have a common financial year which ends on December 31.
All intra-group balances, transactions, unrealised gains and losses resulting from intra-group transactions, income and expenses are eliminated in full.
There are no significant restrictions on the ability of Subsidiaries to transfer funds to the Parent (the Bank) in the form of cash dividend or repayment of loans and advances.
All Subsidiaries of the Bank have been incorporated in Sri Lanka except Commex Sri Lanka S.R.L. which was incorporated in Italy.
A listing of the Bank’s Subsidiaries together with contingencies of Subsidiaries is set out in Notes 28 and 48.3 (a) to the Financial Statements.
The Bank’s interests in all its Subsidiaries together with the summarised financial information including total assets, total liabilities, revenue, profit or loss and the dividends paid are given in the Section on ‘Group Structure’.
3.1.4 Associates
Associates are those entities in which the Group has significant influence, but not control, over the financial and operating policies. Significant influence is presumed to exist when the Group holds between 20% and 50% of the voting power of another entity.
Investments in Associates are accounted for using the equity method and are recognised initially at cost, in terms of Sri Lanka Accounting Standards - LKAS 28 on ‘Investments in Associates’. The Group’s investment includes goodwill identified on acquisition, net of any accumulated impairment losses. The Consolidated Financial Statements include the Group’s share of the income and expenses and equity movements of equity-accounted investees, after adjustments to align the Accounting Policies with those of the Group, from the date that significant influence commences until the date that significant influence ceases. Accordingly, under the Equity Method, investments in Associates are carried at cost plus post-acquisition changes in the Group’s share of net assets of the Associates and are reported as a separate line item in the Statement of Financial Position. The Statement of Comprehensive Income reflects the Group’s share of current year’s profit or loss of the Associates.
When the Group’s share of losses exceeds its interest in an equity-accounted investee, the carrying amount of that interest, including any long term investments, is reduced to nil, and the recognition of further losses is discontinued except to the extent that the Group has an obligation or has made payments on behalf of the investee. If the Associate subsequently reports profits, the Bank resumes recognising its share of those profits only after its share of the profits equal the share of losses not recognised previously.
The Group discontinues the use of the Equity Method from the date that it ceases to have significant influence over an Associate and accounts for such investments in accordance with the Sri Lanka Accounting Standard - LKAS 39 on ‘Financial Instruments: Recognition and Measurement’.
Where there has been a change recognised directly in the equity of the Associate, the Bank recognises its share of any such changes and discloses same, when applicable, in the Consolidated Statement of Changes in Equity.
Profits and losses resulting from transactions between the Bank and the Associates are eliminated to the extent of the interest in such Associate.
The Financial Statements of all Associates in the Group have a common financial year which ends on December 31.
There are no significant restrictions on the ability of the Associates to transfer funds to the Parent (the Bank) in the form of cash dividend or repayment of loans and advances.
A listing of the Group’s Associates together with their fair values and the Group’s share of contingent liabilities of such Associates are set out in Notes 29 and 48.3 (b) to the Financial Statements.
Summarised financial information of all Associates of the Bank together with the Bank’s interests is given in the Section on ‘Group Structure’.
3.1.5 Loss of Control
Upon the loss of control, the Group derecognises the assets and liabilities of the Subsidiary, any non-controlling interests and the other components of equity related to the Subsidiary. Any surplus or deficit arising on the loss of control is recognised in profit or loss. If the Group retains any interest in the previous Subsidiary, then such interest is measured at fair value at the date that control is lost. Subsequently it is accounted for as an Associate or in accordance with the Group’s accounting policy for financial instruments (see Accounting Policy 3.1.3 above) depending on the level of influence retained.
3.1.6 Transactions Eliminated on Consolidation
Intra-group balances and transactions, and any unrealised income and expenses arising from intra-group transactions, are eliminated in full in preparing the Consolidated Financial Statements. Unrealised gains arising from transactions with equity-accounted investees are eliminated against the investment to the extent of the Group’s interest in the investee. Unrealised losses are eliminated in the same way as unrealised gains, but only to the extent that there is no evidence of impairment.
3.1.7 Material Gains or Losses, Provisional Values or Error Corrections
There were no material gains or losses, provisional values or error corrections recognised during the year in respect of the business combinations that took place in previous periods.
3.2 Foreign Currency
3.2.1 Foreign Currency Translations
The Group’s Consolidated Financial Statements are presented in Sri Lankan Rupees, which is also the Bank’s functional currency. Each entity in the Group determines its own functional currency and items included in the Financial Statements of each entity are measured using that functional currency. The Group has elected to recycle the gain or loss that arises from the direct method of consolidation, which is the method the Group uses to complete its consolidation. The Financial Statements of the Off-Shore Banking Unit of the Bank and the Financial Statements of the Foreign Operations of the Bank have been translated into the Group’s presentation currency as explained under Notes 3.2.2 and 3.2.3 below:
3.2.2 Foreign Currency Transactions and Balances
Foreign currency transactions are translated into the functional currency, which is Sri Lankan Rupees, using the exchange rates prevailing at the dates of the transactions. In this regard, the Bank’s practice is to use the middle rate of exchange ruling at the date of the transaction.
Monetary assets and liabilities denominated in foreign currencies at the Reporting date are retranslated to the functional currency at the middle exchange rate of the functional currency ruling at the Reporting date. The foreign currency gain or loss on monetary items is the difference between amortised cost in the functional currency at the beginning of the year adjusted for effective interest and payments during the year, and the amortised cost in foreign currency translated at the exchange rate at the Reporting date.
Non-monetary assets and liabilities denominated in foreign currencies that are measured at fair value are retranslated to the functional currency at the exchange rate at the date that the fair value was determined. Foreign currency differences arising on retranslation are recognised in profit or loss, except for differences arising on the retranslation of available-for-sale equity instruments, a financial liability designated as a hedge of the net investment in a foreign operation, or qualifying cash flow hedges, which are recognised in Other Comprehensive Income. Non-monetary items that are measured in terms of historical cost in a foreign currency are translated using the exchange rate at the date of the transaction.
Goodwill arising on the acquisition of a foreign operation and any fair value adjustments to the carrying amounts of assets and liabilities arising on the acquisition are treated as assets and liabilities of the foreign operation and are translated at the exchange rates ruling at the Reporting date.
3.2.3 Transactions of the Off-Shore Banking Centre
These have been recorded in accordance with Note 3.2.1 above, except the application of the annual weighted average exchange rate for translation of the Statement of Comprehensive Income. Net gains and losses are dealt through the Statement of Comprehensive Income.
3.2.4 Foreign Operations
The results and financial position of overseas branch operations that have a functional currency different from the Bank’s presentation currency are translated into the Bank’s presentation currency as follows:
- Assets and liabilities are translated at the rates of exchange ruling at the Reporting date.
- Income and expenses are translated at the average exchange rate for the period, unless this average rate is not a reasonable approximation of the rate prevailing at the transaction date, in which case income and expenses are translated at the exchange rate ruling at the transaction date.
- All resulting exchange differences are recognised in the Foreign Currency Translation Reserve, which is a separate component of Equity.
When a foreign operation is disposed off, the deferred cumulative translation gain or loss recognised in Equity relating to that particular foreign operation is recognised in the Statement of Comprehensive Income as part of the gain or loss on disposal.
3.3 Financial Instruments - Initial Recognition, Classification and Subsequent Measurement
3.3.1 Date of Recognition
All financial assets and liabilities except ‘Regular way trades’ are initially recognised on the trade date, i.e., the date that the Group becomes a party to the contractual provisions of the instrument. 'Regular way trades' means purchases or sales of financial assets that require delivery of assets within the time frame generally established by regulation or convention in the market place. Those trades are initially recognised on the settlement date.
3.3.2 Initial Measurement of Financial Instruments
The classification of financial instruments at initial recognition depends on their purpose and characteristics and the management’s intention in acquiring them. Please refer Notes 3.3.3 and 3.3.4 below for further details on classification of Financial Instruments.
All financial instruments are measured initially at their fair value plus transaction costs that are directly attributable to acquisition or issue of such financial instrument, except in the case of financial assets and financial liabilities at fair value through profit or loss as per the Sri Lanka Accounting Standard - LKAS 39 on ‘Financial Instruments: Recognition and Measurement’.
Transaction cost in relation to financial assets and financial liabilities at fair value through profit or loss are dealt with through the Statement of Comprehensive Income.
3.3.2.1 ‘Day 1’ Profit or Loss
When the transaction price differs from the fair value of other observable current market transactions in the same instrument, or based on a valuation technique whose variables include only data from observable markets, the Bank recognises the difference between the transaction price and fair value (a ‘Day 1’ profit or loss) in ‘Interest Income and Personnel Expenses’. In cases where fair value is determined using data which is not observable, the difference between the transaction price and model value is only recognised in the Statement of Comprehensive Income when the inputs become observable, or when the instrument is derecognised. The ‘Day 1 loss’ arising in the case of loans granted to employees at concessionary rates under uniformly applicable schemes is deferred and amortised using Effective Interest Rates (EIR) over the remaining service period of the employees or tenure of the loan whichever is shorter.
3.3.3 Classification and Subsequent Measurement of Financial Assets
At inception a financial asset is classified into one of the following categories:
- At fair value through profit or loss:
- Held-for-trading; or
- Designated at fair value through profit or loss.
- Loans and receivables;
- Available-for-sale; or
- Held-to-maturity
The subsequent measurement of financial assets depends on their classification.
Please refer Accounting Policies 3.3.3.1, 3.3.3.2, 3.3.3.3, 3.3.3.4 and 3.3.3.5.
3.3.3.1 Financial Assets at Fair Value through Profit or Loss
Financial assets at fair value through profit or loss includes financial assets held-for-trading and financial assets designated upon initial recognition at fair value through profit or loss which are discussed in 3.3.3.1.1 and 3.3.3.1.2 below.
3.3.3.1.1 Financial Assets Held-for-Trading
Financial assets are classified as held-for-trading if they are acquired principally for the purpose of selling or repurchasing in the near term or holds as a part of a portfolio that is managed together for short-term profit or position taking. This category also includes derivative financial instruments entered into by the Group that are not designated as hedging instruments in hedge relationships as defined by the Sri Lanka Accounting Standard - LKAS 39 on ‘Financial Instruments: Recognition and Measurement’.
Financial assets held-for-trading are recorded in the Statement of Financial Position at fair value. Changes in fair value are recognised in profit or loss. Interest and dividend income is recorded in ‘Net trading income’ according to the terms of the contract, or when the right to receive the payment has been established.
The Group evaluates its financial assets held-for-trading, other than derivatives, to determine whether the intention to sell them in the near term is still appropriate. When the Group is unable to trade these financial assets due to inactive markets and management’s intention to sell them in the foreseeable future significantly changes, the Group may elect to reclassify these financial assets in rare circumstances.
Financial assets held-for-trading include instruments such as Government and other debt securities and equity instrument that have been acquired principally for the purpose of selling or repurchasing in the near term and derivatives, including separated embedded derivatives explained below unless they are designated as effective hedging instruments.
Details of financial assets held-for-trading are given in Note 24 and on the face of the Statement of Financial Position.
Derivatives Recorded at Fair Value through Profit or Loss
The Bank uses derivatives such as interest rate swaps, foreign currency swaps and forward foreign exchange contracts, etc. Derivatives are recorded at fair value and carried as assets when their fair value is positive and as liabilities when their fair value is negative. Changes in the fair value of derivatives are included in ‘Net trading income’.
Derivatives embedded in other financial instruments are treated as separate derivatives and recorded at fair value if their economic characteristics and risks are not closely related to those of the host contract, and the host contract is not itself held-for-trading or designated at fair value through profit or loss. The embedded derivatives separated from the host are carried at fair value in the trading portfolio with changes in fair value recognised in the Statement of Comprehensive Income.
Details of derivatives recorded at fair value through profit or loss are given in Notes 23 and 36.
3.3.3.1.2 Financial Assets Designated at Fair Value through Profit or Loss
The Group designates financial assets at fair value through profit or loss in the following circumstances:
- the assets are managed, evaluated and reported internally at fair value;
- the designation eliminates or significantly reduces an accounting mismatch, which would otherwise have arisen; or
- the asset contains an embedded derivative that significantly modifies the cash flows that would otherwise have been required under the contract.
Financial assets designated at fair value through profit or loss are recorded in the Statement of Financial Position at fair value. Changes in fair value are recorded in ‘Net gain or loss on financial assets and liabilities designated at fair value through profit or loss’. Interest earned is accrued in ‘Interest Income’, using the EIR, while dividend income is recorded in ‘other operating income’ when the right to receive the payment has been established.
The Group has not designated any financial assets upon initial recognition as at fair value through profit or loss.
3.3.3.2 Loans and Receivables to Banks and Other Customers
‘Loans and receivables to banks and other customers’ include non-derivative financial assets with fixed or determinable payments that are not quoted in an active market, other than:
- Those that the Group intends to sell immediately or in the near term and those that the Group, upon initial recognition, designates as at fair value through profit or loss
- Those that the Group, upon initial recognition, designates as available-for-sale
- Those for which the Group may not recover substantially all of its initial investment, other than because of credit deterioration.
‘Loans and receivable to banks and other customers’ include Loans and Advances, Bills of Exchange and Lease Receivable of the Group.
When the Group is the lessor in a lease agreement that transfers substantially all of the risks and rewards incidental to ownership of the asset to the lessee, the arrangement is classified as a finance lease. Amounts receivable under finance leases net of initial rentals received, unearned lease income and provision for impairment are classified as lease receivable and are presented within ‘loans and receivables to customers’ in the Statement of Financial Position.
After initial measurement, ‘loans and receivables to banks and other customers’ are subsequently measured at amortised cost using the EIR, less provision for impairment except when the Group recognises loans and receivables at fair value through profit or loss. Amortised cost is calculated by taking into account any discount or premium on acquisition and fees and costs that are an integral part of the EIR. The amortisation is included in ‘Interest Income’ in the Statement of Comprehensive Income. The losses arising from impairment are recognised in the Statement of Comprehensive Income in ‘impairment charges for loans and other losses’.
The Bank may enter into certain lending commitments where the loan, on draw down, is expected to be classified as held-for-trading because the intent is to sell the loans in the short term. These commitments to lend, if any, are recorded as derivatives and measured at fair value through profit or loss. Where the loan, on drawdown, is expected to be retained by the Bank, and not sold in the short term, the commitment is recorded only when it is an onerous contract that is likely to give rise to a loss.
Details of ‘loans and receivables to banks and other customers’ are given in Notes 25 and 26.
3.3.3.3 Other Financial Investments Classified as Loans and Receivables
‘Other financial investments classified as loans and receivables’ include unquoted debt instruments. After initial measurement, these are subsequently measured at amortised cost using the EIR, less provision for impairment. Amortised cost is calculated by taking into account any discount or premium on acquisition and fees and costs that are an integral part of the EIR. The amortisation is included in ‘Interest Income’ in the Statement of Comprehensive Income. The losses arising from impairment are recognised in the Statement of Comprehensive Income in ‘impairment charges for loans and other losses’.
Details of ‘Other Financial Investments Classified as Loans and Receivables’ are given in Note 26.
3.3.3.4 Available-for-Sale Financial Investments
Available-for-sale financial investments include equity and debt securities. Equity investments classified as available-for-sale are those which are neither classified as held-for-trading nor designated at fair value through profit or loss. Debt securities in this category are intended to be held for an indefinite period of time and may be sold in response to needs for liquidity or in response to changes in the market conditions.
The Group has not designated any loans or receivables as available- for-sale.
After initial measurement, available-for-sale financial investments are subsequently measured at fair value.
Unrealised gains and losses are recognised directly in Equity through Other Comprehensive Income in the ‘available-for-sale reserve’. When the financial investment is disposed of, the cumulative gain or loss previously recognised in Equity is recognised in the Statement of Comprehensive Income in ‘Other operating income’. Where the Group holds more than one investment in the same security, they are deemed to be disposed of on a first-in first-out basis. Interest earned whilst holding available-for-sale financial investments is reported as ‘Interest Income’ using the EIR. Dividends earned whilst holding Available-for-Sale financial investments are recognised in the Statement of Comprehensive Income as ‘other operating income’ when the right to receive the payment has been established. The losses arising from impairment of such investments are recognised in the Statement of Comprehensive Income in ‘Impairment losses on financial investments’ and removed from the ‘Available-for-Sale reserve’.
Details of available-for-sale financial investments are given in Note 27.
3.3.3.5 Held-to-Maturity Financial Investments
Held-to-Maturity financial investments are non-derivative financial assets with fixed or determinable payments and fixed maturities, which the Group has the intention and ability to hold-to-maturity. After initial measurement, held-to-maturity financial investments are subsequently measured at amortised cost using the EIR, less impairment. Amortised cost is calculated by taking into account any discount or premium on acquisition and fees that are an integral part of the EIR. The amortisation is included in ‘Interest Income’ in the Statement of Comprehensive Income. The losses arising from impairment of such investments are recognised in the Statement of Comprehensive Income in ‘impairment charges for loans and other losses’.
If the Group were to sell or reclassify more than an insignificant amount of held-to-maturity investments before maturity (other than in certain specific circumstances permitted in the Sri Lanka Accounting Standard - LKAS 39 on ‘Financial Instruments: Recognition and Measurement’), the entire category would be tainted and would have to be reclassified as Available-for-sale. Furthermore, the Group would be prohibited from classifying any financial asset as held-to-maturity during the following two years.
The Group has not designated any financial instrument as Held-to-Maturity Financial Investment.
3.3.3.6 Cash and Cash Equivalents
Cash and cash equivalents include cash in hand, placements with banks and loans at call and at short notice that are subject to an insignificant risk of changes in their fair value, and are used by the Group in the management of its short-term commitments. They are brought to Financial Statements at their face values or the gross values, where appropriate. There were no cash and cash equivalents held by the Group companies that were not available for use by the Group.
Cash and cash equivalents are carried at amortised cost in the Statement of Financial Position.
Details of cash and cash equivalents are given in Note 20 to the Financial Statements.
3.3.3.7 Balances with Central Banks
The Monetary Law Act requires that all commercial banks operating in Sri Lanka to maintain a statutory reserve equal to 6% on all deposit liabilities denominated in Sri Lankan Rupees (8% in 2012). The Bank’s Bangladesh operation is required to maintain the statutory liquidity requirement of 19% (19% in 2012) on time and demand liabilities (both local and foreign currencies), inclusive of 6% (6% in 2012) in the form of a Cash Reserve Requirement and the balance 13% (13% in 2012) by way of foreign currency and/or in the form of unencumbered securities held with the Bangladesh Bank.
Balances with Central Banks are carried at amortised cost in the Statement of Financial Position.
Details of the balances with Central Banks are given in Note 21 to the Financial Statements.
3.3.4 Classification and Subsequent Measurement of Financial Liabilities
At inception a financial liability is classified into one of the following categories:
- At fair value through profit or loss, or
- Held-for-trading; or
- Designated at fair value through profit or loss
- At amortised cost.
The subsequent measurement of financial liabilities depends on their classification.
Please refer Accounting Policies 3.3.4.1 and 3.3.4.2 as detailed below.
3.3.4.1 Financial Liabilities at Fair Value through Profit or Loss
Financial liabilities at fair value through profit or loss include financial liabilities held-for-trading and financial liabilities designated upon initial recognition as at fair value through profit or loss.
Financial liabilities are classified as held-for-trading if they are acquired principally for the purpose of selling or repurchasing in the near term or holds as a part of a portfolio that is managed together for short-term profit or position taking. This category includes derivative financial instruments entered into by the Group that are not designated as hedging instruments in hedge relationships as defined by the Sri Lanka Accounting Standard - LKAS 39 on ‘Financial Instruments: Recognition and Measurement’. Separated embedded derivatives are also classified as held-for-trading unless they are designated as effective hedging instruments.
Gains or losses on liabilities held-for-trading are recognised in the Statement of Comprehensive Income.
The Group has not designated any financial liabilities upon initial recognition as at fair value through profit or loss.
3.3.4.2 Financial Liabilities at Amortised Cost
Financial instruments issued by the Bank that are not designated at fair value through profit or loss, are classified as liabilities under ‘Due to Banks’, ‘Debt Securities Issued’ or ‘Subordinated Liabilities’ as appropriate, where the substance of the contractual arrangement results in the Bank having an obligation either to deliver cash or another financial asset to the holder, or to satisfy the obligation other than by the exchange of a fixed amount of cash or another financial asset for a fixed number of own equity shares.
After initial recognition, such financial liabilities are subsequently measured at amortised cost using the EIR method. Amortised cost is calculated by taking into account any discount or premium on acquisition and fees or costs that are an integral part of the EIR. The EIR amortisation is included in ‘Interest Expenses’ in the Statement of Comprehensive Income. Gains and losses are recognised in the Statement of Comprehensive Income when the liabilities are derecognised as well as through the EIR amortisation process.
The details of the Bank’s Financial liabilities at amortised cost is disclosed in Notes 35, 37, 38 and 42.
3.3.5 Reclassification of Financial Instruments
The Bank reclassifies non-derivative financial assets out of the ‘held-for-trading’ category and into the ‘available-for-sale’, ‘loans and receivables’, or ‘held-to-maturity’ categories as permitted by the Sri Lanka Accounting Standard -
LKAS 39 on ‘Financial Instruments: Recognition and Measurement’. Further, in certain circumstances, the Bank is permitted to reclassify financial instruments out of the ‘available-for-sale’ category and into the ‘loans and receivables’ category.
Reclassifications are recorded at fair value at the date of reclassification, which becomes the new
amortised cost.
For a financial asset with a fixed maturity reclassified out of the ‘available-for-sale’ category, any previous gain or loss on that asset that has been recognised in Equity is amortised to profit or loss over the remaining life of the asset using the EIR. Any difference between the new amortised cost and the expected cash flows is also amortised over the remaining life of the asset using the EIR. In the case of a financial asset does not have a fixed maturity, the gain or loss is recognised in the profit or loss when such financial asset is sold or disposed of. If the financial asset is subsequently determined to be impaired, then the amount recorded in Equity is recycled to the Statement of Comprehensive Income.
The Bank may reclassify a non-derivative trading asset out of the ‘held-for-trading’ category and into the ‘loans and receivables’ category if it meets the definition of loans and receivables and the Bank has the intention and ability to hold the financial asset for the foreseeable future or until maturity. If a financial asset is reclassified, and if the Bank subsequently increases its estimates of future cash receipts as a result of increased recoverability of those cash receipts, the effect of that increase is recognised as an adjustment to the EIR from the date of the change in estimate.
Reclassification is at the election of management, and is determined on an instrument-by-instrument basis.
The Bank does not reclassify any financial instrument into the fair value through profit or loss category after initial recognition. Further, the Bank does not reclassify any financial instrument out of the fair value through profit or loss category if upon initial recognition it was designated as at fair value through profit or loss.
3.3.6 Derecognition of Financial Assets and Financial Liabilities
3.3.6.1 Financial Assets
A financial asset (or, where applicable a part of a financial asset or part of a group of similar financial assets) is derecognised when:
- The rights to receive cash flows from the asset have expired; or
- The Bank has transferred its rights to receive cash flows from the asset or has assumed an obligation to pay the received cash flows in full without material delay to a third party under a ‘pass-through’ arrangement; and either:
- The Bank has transferred substantially all the risks and rewards of the asset; or
- The Bank has neither transferred nor retained substantially all the risks and rewards of the asset, but has transferred control of the asset.
On derecognition of a financial asset, the difference between the carrying amount of the asset (or the carrying amount allocated to the portion of the asset transferred), and consideration received (including any new asset obtained less any new liability assumed) and any cumulative gain or loss that had been recognised in Other Comprehensive Income is recognised in profit or loss.
When the Bank has transferred its rights to receive cash flows from an asset or has entered into a pass-through arrangement, and has neither transferred nor retained substantially all of the risks and rewards of the asset nor transferred control of the asset, the asset is recognised to the extent of the Bank’s continuing involvement in the asset. In that case, the Bank also recognises an associated liability. The transferred asset and the associated liability are measured on a basis that reflects the rights and obligations that the Bank has retained.
Continuing involvement that takes the form of a guarantee over the transferred asset is measured at the lower of the original carrying amount of the asset and the maximum amount of consideration that the Bank could be required to repay.
3.3.6.2 Financial Liabilities
A financial liability is derecognised when the obligation under the liability is discharged or cancelled or expired.
Where an existing financial liability is replaced by another from the same lender on substantially different terms, or the terms of an existing liability are substantially modified, such an exchange or modification is treated as a derecognition of the original liability and the recognition of a new liability. The difference between the carrying value of the original financial liability and the consideration paid, including any non-cash assets transferred or liabilities assumed, is recognised in profit or loss.
3.3.7 Securities Purchased Under Resale Agreements (Reverse Repos)
When the Group purchases a financial asset and simultaneously enters into an agreement to resale the asset (or a similar asset) at a fixed price on a future date, the arrangement is accounted for as a financial asset in the Group’s Statement of Financial Position reflecting the transaction’s economic substance as a loan granted by the Group. Subsequent to initial recognition, these securities issued are measured at their amortised cost using the EIR method with the corresponding interest receivable being recognised as interest income in profit or loss.
Details of ‘Securities purchased under resale agreements’ are given in Note 26.4 (a) to the Financial Statements.
3.3.8 Offsetting of Financial Instruments
Financial assets and financial liabilities are offset and the net amount reported in the Consolidated Statement of Financial Position if, and only if, there is a currently enforceable legal right to offset the recognised amounts and there is an intention to settle on a net basis, or to realise the assets and settle the liabilities simultaneously.
Income and expenses are presented on a net basis only when permitted under SLFRSs, or for gains and losses arising from a group of similar transactions such as in the Group’s trading activity.
3.3.9 Determination of Fair Value
Fair value is the amount for which an asset could be exchanged, or a liability settled, between knowledgeable, willing parties in an arm’s length transaction on the measurement date.
Fair Value Measurement Hierarchy
Level 1
When available, the Group measures the fair value of an instrument using active quoted prices or dealer price quotations (assets and long positions are measured at a bid price; liabilities and short positions are measured at an asking price), without any deduction for transaction costs. A market is regarded as active if quoted prices are readily and regularly available and represent actual and regularly occurring market transactions on an arm’s length basis.
Level 2
If a market for a financial instrument is not active, then the Group establishes fair value using a valuation technique. Valuation techniques include using recent arm’s length transactions between knowledgeable, willing parties (if available), reference to the current fair value of other instruments that are substantially the same, discounted cash flow analysis, credit models, option pricing models and other relevant valuation models. The chosen valuation technique makes maximum use of market inputs, relies as little as possible on estimates specific to the Group, incorporates all factors that market participants would consider in setting a price, and is consistent with accepted economic methodologies for pricing financial instruments. Inputs to valuation techniques reasonably represent market expectations and measures of the risk-return factors inherent in the financial instrument. The Group calibrates valuation techniques and tests them for validity using prices from observable current market transactions in the same instrument or based on other available observable market data.
Level 3
Certain financial instruments are recorded at fair value using valuation techniques in which current market transactions or observable market data are not available. There fair value is determined by using valuation models that have been tested against prices or inputs to actual market transactions and also using the best estimate of the most appropriate model assumptions. Models are adjusted to reflect the spread for bid and ask prices to reflect costs to close out positions, credit and debit valuation adjustments, liquidity spread and limitations in the models. Also, profit or loss calculated when such financial instruments are first recorded (‘Day 1’ profit or loss) is deferred and recognised only when the inputs become observable or on derecognition of the instrument (Refer Note 3.3.2.1).
An analysis of fair values of financial instruments and further details as to how they are measured are provided in Note 3.3.
3.3.10 Impairment of Financial Assets
At each Reporting date the Group assesses whether there is objective evidence that a financial asset or a group of financial assets not carried at fair value through profit or loss are impaired. A financial asset or a group of financial assets is deemed to be impaired if, and only if, there is objective evidence of impairment as a result of one or more events that have occurred after the initial recognition of the asset (an ‘incurred loss event’) and that loss event (or events) has an impact on the estimated future cash flows of the financial asset or the group of financial assets that can be reliably estimated.
Objective evidence that financial assets (including equity securities) are impaired can include:
- significant financial difficulty of the borrower or issuer,
- reschedulement of credit facilities,
- default or delinquency by a borrower,
- restructuring of a loan or advance by the Group on terms that the Group would not otherwise consider,
- indications that a borrower or issuer will enter bankruptcy,
- the disappearance of an active market for a security, or
- other observable data relating to a group of assets such as adverse changes in the payment status of borrowers or issuers in the Group, or economic conditions that correlate with defaults in the Group.
In general, the Group considers a decline of 20% to be ‘significant’ and a period of nine months to be ‘prolonged’. However, in specific circumstances a smaller decline or a shorter period may be appropriate.
3.3.10.1 Impairment of Financial Assets Carried at Amortised Cost
For financial assets carried at amortised cost (such as amounts due from banks, loans and advances to customers as well as held-to-maturity investments, if any), the Group/Bank first assesses individually whether objective evidence of impairment exists for financial assets that are individually significant, or collectively for financial assets that are not individually significant. If the Group/Bank determines that no objective evidence of impairment exists for an individually assessed financial asset, it includes the asset in a group of financial assets with similar credit risk characteristics and collectively assesses them for impairment. Assets that are individually assessed for impairment and for which an impairment loss is, or continues to be, recognised are not included in a collective assessment of impairment.
If there is objective evidence that an impairment loss has been incurred, the amount of the loss is measured as the difference between the asset’s carrying amount and the present value of estimated future cash flows (excluding future expected credit losses that have not yet been incurred). The carrying amount of the asset is reduced through the use of a provision account and the amount of impairment loss is recognised in the Statement of Comprehensive Income. Interest income continues to be accrued on the reduced carrying amount/impaired balance and is accrued using the rate of interest used to discount the future cash flows for the purpose of measuring the impairment loss. The interest income is recorded in ‘Interest income’.
Loans together with the associated provision are written-off when there is no realistic prospect of future recovery and all collateral has been realised or has been transferred to the Bank. If, in a subsequent year, the amount of the estimated impairment loss increases or decreases because of an event occurring after the impairment was recognised, the previously recognised impairment loss is increased or reduced by adjusting the provision account. If a future write-off is later recovered, the recovery is credited to ’Other Income’.
The present value of the estimated future cash flows is discounted at the financial asset’s original EIR. If a loan has a variable interest rate, the discount rate for measuring any impairment loss is the current EIR. If the Bank has reclassified trading assets to loans and advances, the discount rate for measuring any impairment loss is the new EIR determined at the reclassification date.
The calculation of the present value of the estimated future cash flows of a collateralised financial asset reflects the cash flows that may result from foreclosure less costs for obtaining and selling the collateral, whether or not foreclosure is probable.
For the purpose of a collective evaluation of impairment, financial assets are grouped on the basis of the Bank’s internal credit grading system, that considers credit risk characteristics such as asset type, industry, geographical location, collateral type, past-due status and other relevant factors.
Future cash flows on a group of financial assets that are collectively evaluated for impairment are estimated on the basis of historical loss experience for assets with credit risk characteristics similar to those in the group. Historical loss experience is adjusted on the basis of current observable data to reflect the effects of current conditions on which the historical loss experience is based and to remove the effects of conditions in the historical period that do not exist currently.
Estimates of changes in future cash flows reflect, and are directionally consistent with, changes in related observable data from year-to-year (such as changes in policy rates, inflation, growth in GDP, sovereign rating, or other factors that are indicative of incurred losses in the group and their magnitude). The methodology and assumptions used for estimating future cash flows are reviewed regularly to reduce any differences between loss estimates and actual loss experience.
Details of impairment losses on financial assets carried at amortised cost and an analysis of the impairment provision on loans and advances by class are given in Note 12.
Impairment of Rescheduled Loans and Advances
Where possible, the Bank seeks to reschedule loans and advances rather than to take possession of collateral. This may involve extending the payment arrangements and the agreement of new loan conditions. In case of individually significant rescheduled credit facilities, once the terms have been renegotiated, any impairment is measured using the original EIR as calculated before the modification of terms and the loan/advance is no longer considered past due. Management continually reviews renegotiated loans and advances to ensure that all criteria are met and that future payments are likely to occur.
Collateral Valuation
The Bank seeks to use collateral, where possible, to mitigate its risks on financial assets. The collateral comes in various forms such as cash, gold, Government securities, letters of credit/guarantees, real estate, receivables, inventories, other non-financial assets and credit enhancements such as netting agreements. The fair value of collateral is generally assessed, at a minimum, at inception and based on the Bank’s annual reporting schedule.
To the extent possible, the Bank uses active market data for valuing financial assets, held as collateral. Other financial assets which do not have a readily determinable market value are valued using models. Non-financial collateral, such as real estate, is value-based on data provided by third parties such as professional valuers, Audited Financial Statements, and other independent sources.
Collateral Repossessed
The Bank’s policy is to carry collaterals repossessed at fair value at the repossession date and such assets will be disposed at the earliest possible opportunity. These assets are recorded under assets held-for-sale as per the Sri Lanka Accounting Standard - SLFRS 5 on ‘Non-Current Assets Held for Sale and Discontinued Operations’.
3.3.10.2 Impairment of Financial Investments - Available-for-Sale
For available-for-sale financial investments, the Bank assesses at each Reporting date whether there is objective evidence that an investment is impaired.
In the case of debt instruments classified as available-for-sale, the Bank assesses individually whether there is objective evidence of impairment based on the same criteria as financial assets carried at amortised cost. However, the amount recorded for impairment is the cumulative loss measured as the difference between the amortised cost and the current fair value, less any impairment loss on that investment previously recognised in the Statement of Comprehensive Income. Future interest income is based on the reduced carrying amount/impaired balance and is accrued using the rate of interest used to discount the future cash flows for the purpose of measuring the impairment loss. The interest income on such assets too is recorded within ‘Interest income’. If, in a subsequent period, the fair value of a debt instrument increases and the increase can be objectively related to a credit event occurring after the impairment loss was recognised in the Statement of Comprehensive Income, the impairment loss is reversed through the Statement of Comprehensive Income.
In the case of equity investments classified as available-for-sale, objective evidence would also include a ‘significant’ or ‘prolonged’ decline in the fair value of the investment below its cost. Where there is evidence of impairment, the cumulative impairment loss on that investment previously recognised in Equity through Other Comprehensive Income is removed from Equity and recognised in the Income Statement. However, any subsequent recovery in the fair value of an impaired Available-for-sale equity security is recognised in Other Comprehensive Income.
The Group writes-off certain Financial Investments - Available-for-Sale when they are determined to be uncollectible.
3.4 Non-Current Assets Held-for-Sale and Disposal Groups
The Group/Bank intends to recover the value of Non-current Assets and disposal groups classified as held-for-sale as at the Reporting date principally through a sale transaction rather than through continuing use. This condition is regarded as met only when the sale is highly probable and the asset or disposal group is available for immediate sale in its present condition, management has committed to the sale, and the sale is expected to have been completed within one year from the date of classification.
As per the Sri Lanka Accounting Standard - SLFRS 5 on ‘Non-current Assets Held-for-Sale and Discontinued Operations’, these assets are measured at the lower of the carrying amount and fair value, less costs to sell. Thereafter, the Group/Bank assesses at each Reporting date or more frequently if events or changes in circumstances indicate that the investment or a group of investment is impaired. The Group/Bank recognises an impairment loss for any initial or subsequent write down of the assets to fair value less costs to sell and also recognises a gain for any subsequent increase in fair value less costs to sell of an asset, only to the extent of the cumulative impairment losses that have been recognised previously. As a result, once classified, the Group/Bank neither amortise nor depreciate the assets classified as held-for-sale.
In the Consolidated Statement of Comprehensive Income of the Reporting period, and of the comparable period of the previous year, income and expenses from discontinued operations are reported separately from income and expenses from continuing operations, down to the level of profit after taxes, even when the Bank retains a non-controlling interest in the subsidiary after the sale. The resulting profit or loss (after taxes) is reported separately in the Statement of Comprehensive Income.
3.5 Leasing
The determination of whether an arrangement is a lease, or it contains a lease, is based on the substance of the arrangement and requires an assessment of whether the fulfilment of the arrangement is dependent on the use of a specific asset or assets and the arrangement conveys a right to use the asset.
3.5.1 Operating Leases - Bank as a Lessee
Leases that do not transfer to the Bank substantially all the risks and benefits incidental to ownership of the leased assets are operating leases. Operating lease payments are recognised as an expense in the Income Statement on a straight-line basis over the lease term. Contingent rental payable is recognised as an expense in the period in which they are incurred.
Details of Operating Leases - Bank as a lessee are given in Note 32.
3.5.2 Operating Leases - Bank as a Lessor
Leases where the Bank does not transfer substantially all of the risk and benefits of ownership of the asset are classified as operating leases. Initial direct costs incurred in negotiating operating leases are added to the carrying amount of the leased asset and recognised over the lease term on the same basis as rental income.
Contingent rents are recognised as revenue in the period in which they are earned.
3.6 Property, Plant & Equipment
The Group applies the requirements of the Sri Lanka Accounting Standard - LKAS 16 on ‘Property, Plant & Equipment’ in accounting for its owned assets (including buildings under operating leases where the Bank is the lessee) which are held for and use in the provision of services, for rental to others or for administrative purposes and are expected to be used for more than one year.
3.6.1 Basis of Recognition
Property, Plant & Equipment are recognised if it is probable that future economic benefits associated with the asset will flow to the Group and cost of the asset can be reliably measured.
3.6.2 Basis of Measurement
An item of Property, Plant & Equipment that qualifies for recognition as an asset is initially measured at its cost. Cost includes expenditure that is directly attributable to the acquisition of the asset and subsequent costs (excluding the costs of day-to-day servicing) as explained in Note 3.6.3 below. The cost of self-constructed assets includes the cost of materials and direct labour, any other costs directly attributable to bringing the asset to a working condition for its intended use and the costs of dismantling and removing the items and restoring the site on which they are located and capitalised borrowing costs. Purchased software which is integral to the functionality of the related equipment is capitalised as part of Computer Equipment.
When parts of an item of property or equipment have different useful lives, they are accounted for as separate items (major components) of property and equipment.
3.6.2.1 Cost Model
The Group applies the cost model to all Property, Plant & Equipment except freehold land and freehold and leasehold buildings and records at cost of purchase together with any incidental expenses thereon, less accumulated depreciation and any accumulated impairment losses.
3.6.2.2 Revaluation Model
The Group applies the Revaluation Model for the entire class of freehold land and freehold and leasehold buildings for measurement after initial recognition. Such properties are carried at revalued amounts, being their fair value at the date of revaluation, less any subsequent accumulated depreciation on buildings and any accumulated impairment losses charged subsequent to the date of valuation. Freehold land and buildings of the Group are revalued every five to seven years or more frequently if the fair values are substantially different from their carrying amounts to ensure that the carrying amounts do not differ from the fair values at the Reporting date.
On revaluation of an asset, any increase in the carrying amount is recognised in Other Comprehensive Income and presented in Revaluation Reserve in Equity or used to reverse a previous loss on revaluation of the same asset, which was charged to the Income Statement. In this circumstance, the increase is recognised as income only to the extent of the previous write down in value. Any decrease in the carrying amount is recognised as an expense in the Income Statement or charged in Other Comprehensive Income and presented in Revaluation Reserve in Equity only to the extent of any credit balance existing in the Revaluation Reserve in respect of that asset. Any balance remaining in the Revaluation Reserve in respect of an asset, is transferred directly to Retained Earnings on Retirement or disposal of the asset.
The Group last revalued all its freehold land and buildings as at December 31, 2011.
3.6.3 Subsequent Cost
These are costs that are recognised in the carrying amount of an asset if it is probable that the future economic benefits embodied within that part of the cost will flow to the Group and it can be reliably measured. The costs of the day-to-day servicing of property and equipment are recognised in profit or loss as incurred.
3.6.4 Derecognition
An item of Property, Plant & Equipment is derecognised upon disposal or when no future economic benefits are expected from its use. Any gain or loss arising on derecognising of the asset (calculated as the difference between the net disposal proceeds and the carrying amount of the asset), is recognised in ‘Other Income/Expenses’ in profit or loss in the year the asset is derecognised.
When replacement costs are recognised in the carrying amount of an item of Property, Plant & Equipment, the remaining carrying amount of the replaced part is derecognised as required by Sri Lanka Accounting Standard - LKAS 16 on ‘Property, Plant & Equipment’.
3.6.5 Capital Work-in-Progress
These are expenses of a capital nature directly incurred in the construction of buildings, major plant and machinery and system development, awaiting capitalisation. These are stated in the Statement of Financial Position at cost.
3.6.6 Depreciation
Depreciation is recognised in profit or loss on a straight-line basis over the estimated useful lives of each part of an item of property and equipment since this method most closely reflects the expected pattern of consumption of the future economic benefits embodied in the asset. Leased assets under finance leases are depreciated over the shorter of the lease term and their useful lives. Freehold land is not depreciated.
The estimated useful lives for the current and comparative years are as follows:
| Class of Asset | % Per Annum | Period |
| Freehold and leasehold buildings | 2.5 | 40 years |
| Motor vehicles | 20 | 5 years |
| Computer equipment | 20 | 5 years |
| Office equipment | 20 | 5 years |
| Furniture & fittings | 10 | 10 years |
| Office interior work | 10 | 10 years |
| Machinery & equipment | 10 | 10 years |
The above rates are compatible with the rates used by all Group entities.
The depreciation rates are determined separately for each significant part of an item of Property, Plant & Equipment and commence to depreciate when it is available-for-use, i.e., when it is in the location and condition necessary for it to be capable of operating in the manner intended by the management. Depreciation of an asset ceases at the earlier of the date that the asset is classified as held-for-sale or the date that the asset is derecognised.
Depreciation methods, useful lives and residual values are reassessed at each Reporting date and adjusted if appropriate.
All classes of Property, Plant & Equipment together with the reconciliation of carrying amounts and accumulated depreciation at the beginning and at the end of the year are given in Note 30.
3.7 Intangible Assets
The Bank’s intangible assets include the value of computer software and copy rights.
3.7.1 Basis of Recognition
An intangible asset is recognised if it is probable that future economic benefits that are attributable to the asset will flow to the entity and the cost of the asset can be measured reliably in accordance with the Sri Lanka Accounting Standard - LKAS 38 on ‘Intangible Assets’.
Intangible assets acquired separately are measured on initial recognition at cost. The cost of intangible assets acquired in a business combination is their fair value as at the date of acquisition. Following initial recognition, these assets are stated in the Statement of Financial Position at cost, less accumulated amortisation and accumulated impairment losses, if any.
3.7.2 Subsequent Expenditure
Subsequent expenditure on intangible assets is capitalised only when it increases the future economic benefits embodied in the specific asset to which it relates. All other expenditure is expensed as incurred.
3.7.3 Useful Economic Lives, Amortisation and Impairment
The useful economic lives of intangible assets are assessed to be either finite or indefinite. The Group does not possess intangible assets with indefinite useful economic lives. Useful economic lives, amortisation and impairment of finite and indefinite intangible assets are described below:
3.7.3.1 Intangible Assets with Finite Lives and Amortisation
Intangible assets with finite lives are amortised over the useful economic lives. The amortisation period and the amortisation method for an intangible asset with a finite useful life are reviewed at least at each Reporting date. Changes in the expected useful life or the expected pattern of consumption of future economic benefits embodied in the asset are accounted for by changing the amortisation period or method, as appropriate, and are treated as changes in accounting estimates. The amortisation expense on intangible assets with finite lives is expensed as incurred.
3.7.3.1.1 Computer Software
All computer software costs incurred, licensed for use by the Group, which are not integrally related to associated hardware, which can be clearly identified, reliably measured and it is probable that they will lead to future economic benefits, are included in the Statement of Financial Position under the category of Intangible Assets and carried at cost, less accumulated amortisation and accumulated impairment losses, if any.
3.7.3.1.2 Amortisation of Intangible Assets
Intangible assets are amortised using the straight-line method to write down the cost over its estimated useful economic lives at the rates specified below:
| Class of Asset | % Per Annum | Period |
| Computer software | 20 | 5 years |
Above rate is in consistent with the rates used in the comparative years.
The unamortised balances of intangible assets with finite lives are reviewed for impairment whenever there is an indication for impairment and recognised in profit or loss to the extent that they are no longer probable of being recovered from the expected future benefits.
3.7.3.2 Intangible Assets with Indefinite Useful Lives
Intangible assets with indefinite useful lives are not amortised but are tested for impairment annually either individually or at the cash-generating unit level as appropriate, when circumstances indicate that the carrying value is impaired. The useful life of an intangible asset with an indefinite life is reviewed annually to determine whether indefinite life assessment continues to be supportable. If not, the change in the useful life assessment from indefinite to finite is made on a prospective basis.
The Group/Bank does not have Intangible Assets with indefinite useful lives.
3.7.4 Derecognition of Intangible Assets
Intangible assets are derecognised on disposal or when no future economic benefits are expected from their use. Gains or losses arising from derecognition of an intangible asset are measured as the difference between the net disposal proceeds and the carrying amount of the asset and are recognised in profit or loss.
The Group has only acquired intangible assets, a list of which with the reconciliation of carrying amounts, accumulated amortisation at the beginning and at the end of the periods is given in Note 31.
Amortisation recognised during the year in respect of intangible assets is included under the item of ‘Amortisation of intangible assets’ in the Statement of Comprehensive Income.
3.8 Impairment of Non-Financial Assets
The carrying amounts of the Group’s non-financial assets, other than deferred tax assets are reviewed at each Reporting date whether there is an indication that an asset may be impaired. If any indication exists, or when annual impairment testing for an asset is required, the Group estimates the asset’s recoverable amount. An asset’s recoverable amount is the higher of an asset’s or cash-generating unit’s fair value less costs to sell and its value in use. Where the carrying amount of an asset or cash-generating unit exceeds its recoverable amount, the asset is considered impaired and is written down to its recoverable amount.
In assessing value in use, the estimated future cash flows are discounted to their present value using a pre-tax discount rate that reflects current market assessments of the time value of money and the risks specific to the asset. In determining fair value less costs to sell, an appropriate valuation model is used. These calculations are corroborated by valuation multiples, quoted share prices for publicly traded subsidiaries or other available fair value indicators.
Impairment losses of continuing operations are recognised in profit or loss under those expense categories consistent with the function of the impaired asset, except for property previously revalued where the gain or loss on revaluation was taken to Equity. In this case, the impairment is also recognised in Equity up to the extent of any previously recognised revaluation gains.
For assets excluding goodwill, an assessment is made at each Reporting date as to whether there is any indication that previously recognised impairment losses may no longer exist or may have decreased. If such indication exists, the Group estimates the asset’s or cash-generating Unit’s recoverable amount. A previously recognised impairment loss is reversed only if there has been a change in the assumptions used to determine the asset’s recoverable amount since the last impairment loss was recognised. The reversal is limited so that the carrying amount of the asset does not exceed its recoverable amount, nor exceeds the carrying amount that would have been determined, net of depreciation/amortisation, had no impairment loss been recognised for the asset in prior years. Such reversal is recognised in profit or loss.
3.9 Deposits, Borrowings, Debt Securities Issued and Subordinated Liabilities
Deposits, borrowings, debt securities issued and subordinated liabilities are the Group’s sources of debt funding.
3.9.1 Due to Banks and Other Financial Institutions
These represents refinance borrowings, call money borrowings, credit balances in Nostro Accounts and borrowings from financial institutions. Subsequent to initial recognition deposits are measured at their amortised cost using the EIR method. Interest paid/payable on these borrowings is recognised in profit or loss.
Details of the ‘Due to banks and other financial institutions’ are given in Notes 35 and 37.
3.9.2 Due to Customers
These include non-interest-bearing deposits, savings deposits, term deposits, deposits payable at call and certificates of deposit. Subsequent to initial recognition deposits are measured at their amortised cost using the EIR method, except where the Group designates liabilities at fair value through profit or loss. Interest paid/payable on these deposits is recognised in profit or loss.
Details of ‘Deposits from customers’ are given in Note 37.
3.9.3 Debt Securities Issued
These represent the funds borrowed by the Bank for long-term funding requirements. Subsequent to initial recognition debt securities issued are measured at their amortised cost using the EIR method, except where the Group designates debt securities issued at fair value through profit or loss. Interest paid/payable is recognised in profit or loss.
3.9.4 Securities Sold Under Repurchase Agreements (Repos)
When the Group sells a financial asset and simultaneously enters into an agreement to repurchase the asset (or a similar asset) at a fixed price on a future date (Repo), the arrangement is accounted for as a financial liability, and the underlying asset continues to be recognised in the Group’s Financial Statements as the Group retains substantially all of the risks and rewards of ownership. The corresponding cash received is recognised in the Consolidated Statement of Financial Position as an asset with a corresponding obligation to return it as a liability under ‘Securities sold under repurchase agreements’, reflecting the transaction’s economic substance as a loan to the Group.
Subsequent to initial recognition, these securities sold are measured at their amortised cost using the EIR method with the corresponding interest payable is recognised as interest expense in profit or loss.
Details of ‘Securities sold under repurchase agreements’ are given in Note 35 and 38.
3.10 Dividends Payable
Dividends on ordinary shares are recognised as a liability and deducted from Equity when they are recommended and declared by the Board of Directors and approved by the shareholders. Interim dividends are deducted from Equity when they are declared and no longer at the discretion of the Bank.
Dividends for the year that are approved after the Reporting date are disclosed as an event after the Reporting Period in accordance with the Sri Lanka Accounting Standard - LKAS 10 on ‘Events after the Reporting Period’.
3.11 Other Liabilities
Other Liabilities include interest, fees and expenses and amounts payable for gratuity/pensions and other provisions. These liabilities are recorded at amounts expected to be payable at the Reporting date.
Details of ‘Other Liabilities’ are given in Note 40.
3.12 Provisions
A provision is recognised in the Statement of Financial Position when the Group has a legal or constructive obligation as a result of a past event and it is probable that an outflow of economic benefits will be required to settle the obligation and the amount of the provision can be measured reliably in accordance with the Sri Lanka Accounting Standard - LKAS 37 on ‘Provisions, Contingent Liabilities and Contingent Assets’. The amount recognised is the best estimate of the consideration required to settle the present obligation at the Reporting date, taking into account the risks and uncertainties surrounding the obligation at that date. Where a provision is measured using the cash flows estimated to settle the present obligation, its carrying amount is determined based on the present value of those cash flows.
A provision for onerous contracts is recognised when the expected benefits to be derived by the Group from a contract are lower than the unavoidable cost of meeting its obligations under the contract. The provision is measured at the present value of the lower of the expected cost of terminating the contract and the expected net cost of continuing with the contract.
3.13 Employee Benefits
3.13.1 Defined Benefit Plans (DBPs)
A Defined Benefit Plan is a post-employment benefit plan other than a Defined Contribution Plan as defined in the Sri Lanka Accounting Standard - LKAS 19 on ‘Employee Benefits’.
3.13.1.1 Defined Benefit Pension Plans
3.13.1.1.1 Description of the Plans and Employee Groups Covered
The Bank operates three types of Defined Benefit Pension Plans for its employees as described below:
- a. The Bank has an approved Pension Fund, which was established in 1992. As per the Deed of Trust, only those employees who were less than 45 years of age as at January 1, 1992 were covered by the Pension Fund in order to leave a minimum contribution for a period of 10 years before they are eligible to draw pension from the Pension Fund. Further, only the employees who joined the Bank on or before December 31, 2001, were in pensionable service of the Bank.
- During 2006, the Bank offered a restructured pension scheme to convert the Defined Benefit Plan (DBP) to a Defined Contribution Plan (DCP) for the pensionable employees of the Bank and over 99% of them accepted it. As a result, the above Pension Fund now covers only those employees who did not opt for the restructured pension scheme and those employees who were covered by the Pension Fund previously but retired before the restructured pension scheme came into effect.
- b. Provision for pensions has been made for those employees who retired on or before December 31, 2001, and on whose behalf the Bank could not make contributions to the Retirement Pension Fund for more than 10 years. This liability although not funded has been provided for in full in the Financial Statements.
- c. Provision has been made in the Financial Statements for Retirement Gratuity from the first year of service for all employees who joined the Bank on or after January 1, 2002, as they are not in pensionable service of the Bank under either the DBP or DCP. However, if any of these employees resigns before retirement, the Bank is liable to pay gratuity to such employees. This liability although not funded has been provided for in full in the Financial Statements.
The Subsidiaries of the Bank do not operate Pension Funds.
The Bank’s net obligation in respect of Defined Benefit Pension Plans is calculated separately for each plan by using the Projected Unit Credit Actuarial Valuation Method, as per the Sri Lanka Accounting Standard - LKAS 19 on ‘Employee Benefits’. This method involves estimating the amount of future benefit that employees have earned in return for their service in the current and prior periods. That benefit is discounted to determine its present value as detailed in Note 51.
The past service cost is recognised as an expense on a straight-line basis over the period until the benefits become vested. If the benefits are already vested following the introduction of, or changes to, a pension plan, past service cost is recognised immediately.
3.13.1.1.2 Recognition of Actuarial Gains or Losses
Actuarial gains or losses are recognised in the Other Comprehensive Income in the period in which they arise.
3.13.1.1.3 Recognition of Retirement Benefit Obligation
The defined benefit asset or liability comprises the present value of the defined benefit obligation, less past service cost not yet recognised and less the fair value of plan assets out of which the obligations are to be settled directly. The value of any asset is restricted to the sum of any past service cost not yet recognised and the present value of any economic benefits available in the form of refunds from the plan or reductions in the future contributions to the plan.
3.13.2 Defined Contribution Plans (DCPs)
A Defined Contribution Plan is a post-employment plan under which an entity pays fixed contributions into a separate entity and will have no legal or constructive obligations to pay a further amount. Obligations to DCPs are recognised in the profit or loss as incurred. The Group has three such plans as explained in Notes 3.13.2.1, 3.13.2.2 and 3.13.2.3 below.
Amounts recognised in profit or loss as expenses on DCPs are given in Note 13.
3.13.2.1 Defined Contribution Pension Plans
As explained in Note 3.13.1.1.1.a, during 2006, the Bank restructured its pension scheme which was a DBP to a DCP. This restructured plan was offered on a voluntary basis to the eligible employees of the Bank. The scheme provides for lump sum payments instead of commuted/monthly pensions to the eligible employees at the point of their separation, in return for surrendering their pension rights. The lump sum offered consisted of a past service package and a future service package. The shortfall on account of the past service package in excess of the funds available in the Pension Fund was borne by the Bank in 2006.
The future service package includes monthly contributions to be made by the Bank for the employees who accepted the offer, to be made during their remaining period of service, at pre-determined contribution rates to be applied for on their salaries, which are estimated to increase for this purpose at 10% p.a. based on the salary levels that prevailed as at the date of implementation of this scheme. In addition, interest to be earned on the assets of the DCP is also allocated to the employees who opted for the restructured scheme.
The assets of this Fund are held separately from those of the Bank and are independently administered by the Trustees as per the provisions of the Trust Deed.
3.13.2.2 Employees’ Provident Fund
The Bank and employees contribute to the approved Private Provident Fund at 12% and 8% respectively, on the salaries of each employee. Other entities of the Group and their employees contribute at the same percentages as above to the Employees’ Provident Fund managed by the Central Bank of Sri Lanka.
3.13.2.3 Employees’ Trust Fund
The Bank and other entities of the Group contribute at the rate of 3% of the salaries of each employee to the Employees’ Trust Fund managed by the Central Bank of Sri Lanka.
3.13.3 Other Long-Term Employee Benefits
The Group’s net obligation in respect of long-term employee benefits other than pension plans is the amount of future benefits that employees have earned in return for their service in the current and prior periods. That benefit is discounted to determine its present value, and the fair value of any related assets is deducted. The discount rate used as the yield at the Reporting date was the current market rate that has been extrapolated to reflect long-term rate of discount based on market rates of interest on short-term corporate/government bonds and anticipated long-term rate of inflation. The calculation is performed using the Projected Unit Credit Method. Any actuarial gains and losses are recognised in profit or loss in the period in which they arise.
The Group does not have any other long-term employee benefit plans.
3.13.4 Terminal Benefits
Termination benefits are recognised as an expense when the Group is committed demonstrably, without realistic possibility of withdrawal, to a formal detailed plan to either terminate employment before the normal retirement date, or to provide termination benefits as a result of an offer made to encourage voluntary redundancy. Termination benefits for voluntary redundancies are recognised as an expense if the Group has made an offer of voluntary redundancy, it is probable that the offer will be accepted, and the number of acceptances can be estimated reliably. If benefits are payable after more than one year from the Reporting date, then they are discounted to their present value.
3.13.5 Other Short-Term Employee Benefits
Short-term employee benefit obligations are measured on an undiscounted basis and are expensed as the related service is provided. A liability is recognised for the amount expected to be paid under short-term cash bonus or profit-sharing plans if the Group has a present legal or constructive obligation to pay this amount as a result of past service provided by the employee and the obligation can be estimated reliably.
3.13.6 Equity Compensation Benefits
Share-based payment arrangements in which the Bank receives goods or services as consideration for its own equity instruments are accounted for as equity-settled share-based payment transactions, regardless of how the equity instruments are obtained by the Bank. Employees (including Senior Executives) of the Bank receive remuneration in the form of share-based payment transactions, whereby employees render services as consideration for equity instruments (equity-settled transactions). The Bank does not operate any cash-settled share-based payment transactions.
The Bank applies the requirements of the Sri Lanka Accounting Standard - SLFRS 2 on ‘Share-Based Payment’ in accounting for equity settled share-based payment transactions, if any, that were granted after January 1, 2012 and had not vested at the same date. As per the Sri Lanka Accounting Standard - SLFRS 2 on ‘Share-Based Payment’, on the grant date fair value of equity-settled share-based payment awards (i.e., share options) granted to employees is recognised as an employee expense, with a corresponding increase in equity, over the period in which the employees unconditionally become entitled to the awards. The amount recognised as an expense is adjusted to reflect the number of share awards for which the related service and non-market performance vesting conditions are expected to be met such that the amount ultimately recognised as an expense is based on the number of share awards that do meet the related service and non-market performance conditions at the vesting date. For share-based payment awards with non-vesting conditions, the grant-date fair value of the share-based payment is measured to reflect such conditions and there is no true-up for differences between expected and actual outcomes.
As the Bank did not grant any share-based payment transaction after January 1, 2012, it did not apply the above accounting treatment during the year and the proceeds received by the Bank in consideration for the shares issued were accounted for as Stated Capital within equity.
The details of Employee Share Option Plans are given in Notes 43.2.
The dilutive effect of outstanding options is reflected as additional share dilution in the computation of diluted earnings per share as disclosed in Note 16.
3.14 Commitments
All discernible risks are accounted for in determining the amount of other liabilities as explained in Note 3.15 below.
Details of the commitments are given in Note 48.2 to the Financial Statements.
3.15 Contingent Liabilities and Commitments for Leasing Arrangements
Contingent liabilities are possible obligations whose existence will be confirmed only by uncertain future events or present obligations where the transfer of economic benefit is not probable or cannot be readily measured as defined in the Sri Lanka Accounting Standard - LKAS 37 on ‘Provisions, Contingent Liabilities and Contingent Assets’.
To meet the financial needs of customers, the Bank enters into various irrevocable commitments and contingent liabilities. These consist of financial guarantees, letters of credit and other undrawn commitments to lend. Letters of credit and guarantees commit the Bank to make payments on behalf of customers in the event of a specific act, generally related to the import or export of goods. Guarantees and standby letters of credit carry a similar credit risk to loans.
Contingent liabilities are not recognised in the Statement of Financial Position but are disclosed unless its occurrence is remote.
Operating lease commitments of the Bank (as a lessor and as a lessee) and pending legal claims against the Bank too form part of commitments of the Bank.
Even though these obligations may not be recognised on the Statement of Financial Position, they do contain credit risk and are therefore part of the overall risk of the Bank as disclosed in Note 48.1.
All discernible risks are accounted for in determining the amount of other liabilities as explained in Note 39.
3.15.1 Legal Claims
Litigation is a common occurrence in the banking industry due to the nature of the business undertaken. The Bank has formal controls and policies for managing legal claims. Once professional advice has been obtained and the amount of loss reasonably estimated, the Bank makes adjustments to account for any adverse effects which the claims may have on its financial standing. At the Reporting date the Bank had several unresolved legal claims. The significant unresolved legal claims against the Bank for which legal advisor of the Bank advised as the loss is possible, but not probable, that the action will succeed. Accordingly, no provision for any claims has been made in these Financial Statements.
A detailed list of significant pending litigations against the Bank is given in Note 49.
3.15.2 Contingent Liabilities, Commitments of Other Group Entities
The Bank’s share of any contingencies and capital commitments of a Subsidiary or an Associate for which the Bank is also liable severally or otherwise is included with appropriate disclosures.
Details of the commitments and contingencies of other Group entities are given in Note 48.3.
3.16 Earnings Per Share (EPS)
Basic EPS is calculated by dividing the profit or loss attributable to ordinary shareholders of the Bank by the weighted average number of ordinary shares outstanding during the period. Diluted EPS is determined by adjusting the profit or loss attributable to ordinary shareholders and the weighted average number of ordinary shares outstanding for the effects of all dilutive potential ordinary shares, which comprise share options granted to employees.
Details of earnings per share are given in Note 16.
3.17 Operating Segments
An operating segment is a component of the Group that engages in business activities from which it may earn revenues and incur expenses, including revenues and expenses that relate to transactions with any of the Group’s other components, whose operating results are reviewed regularly by the Group Management Committee (being the chief operating decision-maker) to make decisions about resources allocated to each segment and assess its performance, and for which discrete financial information is available.
For each of the strategic divisions, the Group’s management monitors the operating results separately for the purpose of making decisions about resource allocation and performance assessment. Segment performance is evaluated based on operating profits or losses which, in certain respects, are measured differently from operating profits or losses in the Consolidated Financial Statements. Income taxes are managed on a group basis and are not allocated to operating segments.
Interest income is reported on a net basis as management primarily relies on net interest income as a performance measure and not the gross income and expense.
Inter-segment transactions are accounted for at fair market prices charged to inter-bank counterparts for similar services on an arm’s length basis. Such transfers are eliminated on consolidation.
No revenue from transactions with a single external customer or counterparty amounted to 10% or more of the Bank’s total revenue in 2013 or 2012.
Detailed information on the results of each reportable segment as required by the Sri Lanka Accounting Standard - SLFRS 8 on ‘Operating Segments’ is provided in Note 52.
3.18 Fiduciary Assets
The Bank provides trust and other fiduciary services that result in the holding or investing of assets on behalf of its clients. Assets held in a fiduciary capacity are not reported in these Financial Statements as they do not belong to the Bank.
3.19 New Accounting Standards Issued Not Yet Adopted
There are a number of new Accounting Standards, amendments to standards, which have been issued but not yet effective as at the Reporting date have not been applied in preparing these Consolidated Financial Statements. The Group and the Bank will adopt the following new/revised Accounting Standards which will be effective from January 1, 2014/2015. Accordingly, these Accounting Standards have not been applied in preparing these Financial Statements.
- SLFRS 9 - Financial Instruments
- SLFRS 10 - Consolidated Financial Statements
- SLFRS 11 - Joint Arrangements
- SLFRS 12 - Disclosure of Interest in Other Entities
- SLFRS 13 - Fair Value Measurement
Pending a detailed review on these new/revised Accounting Standards, the financial impact is not reasonably estimable as at the date of publication of these Consolidated Financial Statements.
Sri Lanka Accounting Standard - SLFRS 9 ‘Financial Instruments’
The objective of this Accounting Standard is to establish principles for the financial reporting of financial assets and financial liabilities that will present relevant and useful information to users of Financial Statements for their assessment of the amounts, timing and uncertainty of an entity’s future cash flows.
An entity shall apply this SLFRS to all items within the scope of LKAS 39 ‘Financial Instruments: Recognition and Measurement’.
The effective date of this Accounting Standard has been deferred as at the date of publication of these Consolidated/Separate Financial Statements.
Sri Lanka Accounting Standard - SLFRS 10 ‘Consolidated Financial Statements’
The objective of this Accounting Standard is to establish principles for the presentation and preparation of Consolidated Financial Statements when an entity controls one or more other entities.
SLFRS 10 is effective from January 1, 2014.
Sri Lanka Accounting Standard - SLFRS 11 ‘Joint Arrangements’
The objective of this Accounting Standard is to establish principles for financial reporting by entities that have an interest in arrangements that are controlled jointly (i.e., joint arrangements).
SLFRS 11 is effective from January 1, 2014.
Sri Lanka Accounting Standard - SLFRS 12 ‘Disclosure of Interests in Other Entities’
The objective of this Accounting Standard is to require an entity to disclose information that enables users of its Financial Statements to evaluate the nature of, and risks associated with its interests in other entities; and the effects of those interests on its financial position, financial performance and cash flows.
SLFRS 12 will become effective from January 1, 2014.
Sri Lanka Accounting Standard - SLFRS 13, ‘Fair Value Measurement’
This Accounting Standard defines fair value, sets out in a single SLFRS a framework for measuring fair value; and requires disclosures about fair value measurements.
This SLFRS will become effective from January 1, 2014 and shall be applied prospectively as of the beginning of the annual period in which it is initially applied. The disclosure requirements of this SLFRS need not be applied in comparative information provided for periods before initial application of this SLFRS.
4. Significant Accounting Policies - Recognition of Income and Expenses
Revenue is recognised to the extent that it is probable that the economic benefits will flow to the Group and the revenue can be reliably measured. The following specific recognition criteria must also be met before revenue is recognised:
4.1 Interest Income and Expense
For all financial instruments measured at amortised cost, interest income and expense are recognised in profit or loss using the EIR method. The EIR is the rate that exactly discounts the estimated future cash receipts and payments through the expected life of the financial asset or liability (or, where appropriate, a shorter period) to the carrying amount of the financial asset or liability. When calculating the EIR, the Group estimates future cash flows considering all contractual terms of the financial instruments, but not future credit losses.
The calculation of the EIR takes into account all contractual terms of the financial instruments (for example, prepayment options) and includes all material transaction costs and fees that are an integral part of the EIR. Transaction costs include incremental costs that are directly attributable to the acquisition or issue of a financial asset or liability.
The carrying amount of the financial asset or financial liability is adjusted if the Group revises its estimates of receipts or payments. The adjusted carrying amount is calculated based on the original EIR and the change in carrying amount is recorded in ‘Interest Income’ for financial assets and in ’Interest Expenses’ for financial liabilities. However, for a reclassified financial asset for which the Bank subsequently increases its estimates of future cash receipts as a result of increased recoverability of those cash receipts, the effect of that increase is recognised as an adjustment to the EIR from the date of the change in estimate.
Once the recorded value of a financial asset or a group of similar financial assets has been reduced due to an impairment loss, interest income continues to be recognised using the rate of interest used to discount the future cash flows for the purpose of measuring the impairment loss.
4.2 Fees and Commission Income and Expense
Fees and commission income and expense that are integral to the EIR on a financial asset or liability are included in the measurement of the EIR.
Other fees and commission income, including account servicing fees, investment management fees, sales commission, placement fees and syndication fees, are recognised as the related services are performed. Fees earned for the provision of services over a period of time are accrued over that period. Loan commitment fees for loans that are likely to be drawn down and other credit related fees are deferred (together with any incremental costs) and recognised as an adjustment to the EIR on the loan. When it is unlikely that a loan will be drawn down, the loan commitment fees are recognised over the commitment period on a straight-line basis.
Other fees and commission expense relate mainly to transaction and service fees, which are expensed as the services are received.
4.3 Net Trading Income
Results arising from trading activities include all realised and unrealised gains and losses from changes in fair value and related interest income or expense, dividends and foreign exchange differences for financial assets and financial liabilities ‘held-for-trading’.
4.4 Dividend Income
Dividend income is recognised when the Group’s/Bank's right to receive the payment is established. Usually, this is the ex-dividend date for equity securities.
Dividends are presented in ‘net trading income’ for financial instruments at fair value through profit or loss held-for-trading. Dividends on available-for-sale equity securities are presented in ‘other operating income’ in profit or loss unless the dividend clearly represents a recovery of part of the cost of the investment, in which case it is presented as a reduction in the value of the investment.
4.5 Lease Income
In terms of the provisions of the Sri Lanka Accounting Standard - LKAS 17 on ‘Leases’, the recognition of finance income on leasing is accounted, based on a pattern reflecting a constant periodic rate of return on capital outstanding.
The excess of aggregate lease rentals receivable over the cost of the leased assets constitutes the total unearned finance income at the commencement of a lease. The unearned finance income included in the lease rentals receivable is recognised in profit or loss over the term of the lease commencing from the month in which the lease is executed using EIR.
4.6 Lease Payments
Payments made under operating leases are recognised in profit or loss on a straight-line basis over the term of the lease. Lease incentives received are recognised as an integral part of the total lease expense, over the term of the lease.
Minimum lease payments made under finance leases are apportioned between the finance expense and the reduction of the outstanding liability. The finance expense is allocated to each period during the lease term so as to produce a constant periodic rate of interest on the remaining balance of the liability.
Contingent lease payments are accounted for by revising the minimum lease payments over the remaining term of the lease when the lease adjustment is confirmed.
4.7 Rental Income and Expense
Rental income and expense are recognised in the profit or loss on an accrual basis.
4.8 Borrowing Costs
As per the Sri Lanka Accounting Standard - LKAS 23 on ‘Borrowing Costs’, the Group/Bank capitalises borrowing costs that are directly attributable to the acquisition, construction or production of a qualifying asset as part of the cost of the asset. A qualifying asset is an asset which takes a substantial period of time to get ready for its intended use or sale. Other borrowing costs are recognised in the profit or loss in the period in which they occur.
5. Significant Accounting Policies - Income Tax Expense
As per the Sri Lanka Accounting Standard - LKAS 12 on ‘Income Taxes’, tax expense (tax income) is the aggregate amount included in determination of profit or loss for the period in respect of current and deferred taxes. Income tax expense is recognised in the Income Statement except to the extent it relates to items recognised directly in Equity or in Other Comprehensive Income (OCI), in which case it is recognised in Equity or in OCI.
5.1 Current Taxation
Current tax assets and liabilities consist of amounts expected to be recovered from or paid to the taxation authorities in respect of the current as well as prior years. The tax rates and tax laws used to compute the amounts are those that are enacted or substantially enacted by the Reporting date. Accordingly, provision for taxation is made on the basis of the accounting profit for the year as adjusted for taxation purposes in accordance with the provisions of the Inland Revenue Act No. 10 of 2006 and the amendments thereto, at the rates specified in Note 15. This Note also includes the major components of tax expense, the effective tax rates and a reconciliation between the profit before tax and tax expense as required by the Sri Lanka Accounting Standard - LKAS 12 on ‘Income Taxes’.
Provision for taxation on the overseas branch operations is made on the basis of the accounting profit for the year as adjusted for taxation purposes in accordance with the provisions of the relevant statutes in those countries.
5.2 Deferred Taxation
Deferred tax is provided on temporary differences at the Reporting date between the tax bases of assets and liabilities and their carrying amounts for financial reporting purposes for all Group entities.
Deferred tax liabilities are recognised for all temporary differences, except:
- Where the deferred tax liability arises from the initial recognition of goodwill or of an asset or liability in a transaction that is not a business combination and at the time of the transaction, affects neither the accounting profit or loss nor taxable profit or loss; and
- In respect of taxable temporary differences associated with investments in Subsidiaries and Associates, where the timing of the reversal of the temporary differences can be controlled and it is probable that the temporary differences will not reverse in the foreseeable future.
Deferred tax assets are recognised for all deductible differences, unused tax credits and unused tax losses carried forward, if any, to the extent that it is probable that taxable profits will be available against which the deductible temporary differences and the unused tax credits and unused tax losses carried forward can be utilised, except:
- Where the deferred tax assets relating to the deductible temporary difference arise from the initial recognition of an asset or liability in a transaction that is not a business combination and at the time of the transaction, affects neither the accounting profit nor the taxable profit or loss; and
- In respect of deductible temporary differences associated with investments in Subsidiaries and Associates, deferred tax assets are recognised only to the extent that it is probable that the temporary differences will reverse in the foreseeable future and taxable profits will be available against which the temporary differences can be utilised.
The carrying amount of deferred tax assets is reviewed at each Reporting date and reduced to the extent that it is no longer probable that sufficient taxable profits will be available to allow all or part of the deferred tax assets to be utilised. Unrecognised deferred tax assets are reassessed at each Reporting date and are recognised to the extent that it is probable that future taxable profits will allow the deferred tax assets to be recovered.
Deferred tax assets and liabilities are measured at the tax rates that are expected to apply in the year when the assets are realised or the liabilities are settled, based on tax rates and tax laws that have been enacted or substantially enacted at the Reporting date.
Current tax and deferred tax relating to items recognised directly in equity are also recognised in equity and not in the Statement of Comprehensive Income.
Deferred tax assets and deferred tax liabilities are set-off, if a legally enforceable right exists to set-off current tax assets against current tax liabilities and they relate to taxes levied by the same tax authority on the same taxable entity, or on different tax entities, but they intend to settle current tax liabilities and assets on a net basis or their tax assets and liabilities will be realised simultaneously.
Details of Deferred Tax Assets and Liabilities as at the Reporting date are given in Note 33.
5.3 Tax Exposures
In determining the amount of current and deferred tax, the Group/Bank considers the impact of tax exposures, including whether additional taxes and interest may be due. This assessment relies on estimates and assumptions and may involve a series of judgments about future events. New information may become available that causes the Group/Bank to change its judgment regarding the adequacy of existing tax liabilities. Such changes to tax liabilities would impact tax expense in the period in which such a determination is made.
5.4 Crop Insurance Levy (CIL)
As per the provisions of the Section 14 of the Finance Act No. 12 of 2013, the CIL was introduced with effect from April 1, 2013 and is payable to the National Insurance Trust Fund. Currently, the CIL is payable at 1% of the profit after tax.
5.5 Withholding Tax on Dividends, Distributed by the Bank, Subsidiaries and Associates
- Withholding tax on dividends distributed by the Bank.
Withholding tax that arises from the distribution of dividends by the Bank is recognised at the time the liability to pay the related dividend is recognised. - Withholding tax on dividends distributed by the Subsidiaries and Associates.
Dividends received by the Bank from its Subsidiaries and Associates, have attracted a 10% deduction at source.
5.6 Economic Service Charge (ESC)
As per the provisions of the Finance Act No. 11 of 2004, and amendments thereto, the ESC was introduced with effect from April 1, 2004. Currently, the ESC is payable at 0.25% on ‘Exempt Turnover’ and is deductible from the income tax payments. Unclaimed ESC, if any, can be carried forward and set-off against the income tax payable in the five subsequent years.
5.7 Value Added Tax on Financial Services
The base for the computation of Value Added Tax on Financial Services is the accounting profit before emoluments paid to employees and income tax, which is adjusted for the depreciation computed on prescribed rates. The amount of Value Added Tax charged in determining the profit or loss for the period is given in the Income Statement.
6. Statement of Cash Flows
The Statement of Cash Flows has been prepared by using the ‘Indirect Method’ of preparing cash flows in accordance with the Sri Lanka Accounting Standard - LKAS 7 on ‘Statement of Cash Flows’. Cash and cash equivalents comprise of short-term, highly liquid investments that are readily convertible to known amounts of cash and are subject to an insignificant risk of changes in value. Cash and cash Equivalents as referred to in the Statement of Cash Flows are comprised of those items as explained in Note 20.
Refer the Statement of Cash Flows.
| GROUP | BANK | |||
| 2013 | 2012 | 2013 | 2012 | |
| Rs. ’000 | Rs. ’000 | Rs. ’000 | Rs. ’000 | |
7. Net Interest Income |
||||
Interest Income |
||||
| Cash and cash equivalents | 290,537 | 470,764 | 290,537 | 470,764 |
| Placements with banks | 65,013 | 339,115 | 65,013 | 339,115 |
| Derivative financial instruments | – | 314 | – | 314 |
| Other financial instruments held-for-trading | 447,257 | 421,315 | 447,257 | 421,315 |
| Loans and receivables to banks | 6,412 | 19,557 | 6,412 | 19,557 |
| Loans and receivables to other customers | 49,973,484 | 45,037,407 | 49,980,422 | 45,057,595 |
| Financial investments - Available-for-sale | 11,392,946 | 6,374,471 | 11,392,946 | 6,374,471 |
| Other interest income | 1,812 | 21 | 4,370 | 2,296 |
| Total interest income | 62,177,461 | 52,662,964 | 62,186,957 | 52,685,427 |
Interest Expenses
| Due to banks | 439,102 | 226,606 | 439,102 | 226,606 |
| Derivative financial instruments | – | 314 | – | 314 |
| Due to other customers | 32,097,921 | 25,284,506 | 32,103,850 | 25,289,941 |
| Other borrowings | 3,699,055 | 4,167,073 | 3,716,677 | 4,180,730 |
| Subordinated liabilities | 619,126 | 132,806 | 619,126 | 132,806 |
| Total interest expenses | 36,855,204 | 29,811,305 | 36,878,755 | 29,830,397 |
| Net interest income | 25,322,257 | 22,851,659 | 25,308,202 | 22,855,030 |
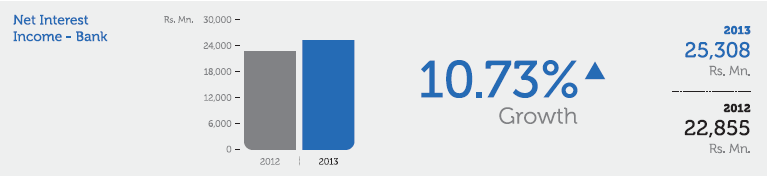
| GROUP | BANK | |||
| 2013 | 2012 | 2013 | 2012 | |
| Rs. ’000 | Rs. ’000 | Rs. ’000 | Rs. ’000 | |
7.1 (a) Net Interest Income from Sri Lanka Government Securities |
||||
| Interest income | 14,159,223 | 8,504,143 | 14,159,223 | 8,504,143 |
| Less: Interest expenses | 3,187,878 | 3,421,816 | 3,205,500 | 3,421,816 |
| Sub total | 10,971,345 | 5,082,327 | 10,953,723 | 5,082,327 |
| GROUP | BANK | |||
| 2013 | 2012 | 2013 | 2012 | |
| Rs. ’000 | Rs. ’000 | Rs. ’000 | Rs. ’000 | |
7.1 (b) Net Interest Income from Bangladesh Government Securities |
||||
| Interest income | 1,121,953 | 773,254 | 1,121,953 | 773,254 |
| Less: Interest expenses | 7,875 | 19,715 | 7,875 | 19,715 |
| Sub total | 1,114,078 | 753,539 | 1,114,078 | 753,539 |
7.2 Interest Income from Other Financial Instruments at Fair Value through Profit or Loss
| Derivative financial instruments | – | 314 | – | 314 |
| Other financial instruments held-for-trading | 447,257 | 421,315 | 447,257 | 421,315 |
| Sub total | 447,257 | 421,629 | 447,257 | 421,629 |
7.3 Interest Income on Impaired Financial Assets
| Interest income from impaired loans and receivables to other customers | 304,712 | 249,760 | 304,712 | 249,760 |
| Sub total | 304,712 | 249,760 | 304,712 | 249,760 |
8. Net Fees and Commission Income
| Fees and commission income [Refer Note 8.1] | 4,880,093 | 4,146,878 | 4,876,517 | 4,146,525 |
| Less: Fees and commission expenses [Refer Note 8.2] | 627,235 | 548,560 | 627,235 | 548,560 |
| Net fees and commission income | 4,252,858 | 3,598,318 | 4,249,282 | 3,597,965 |
8.1 Fees and Commission Income
| Loans and advances | 346,034 | 370,601 | 346,034 | 370,601 |
| Credit and debit cards | 1,455,167 | 1,141,231 | 1,455,167 | 1,141,231 |
| Trade and remittances | 1,794,432 | 1,661,914 | 1,794,432 | 1,661,914 |
| Deposits | 579,589 | 330,976 | 579,640 | 331,028 |
| Guarantees | 481,550 | 439,225 | 481,550 | 439,225 |
| Other financial services | 223,321 | 202,931 | 219,694 | 202,526 |
| Sub total | 4,880,093 | 4,146,878 | 4,876,517 | 4,146,525 |
8.2 Fees and Commission Expenses
| Loans and advances | 35,066 | 30,396 | 35,066 | 30,396 |
| Credit and debit cards | 491,364 | 425,589 | 491,364 | 425,589 |
| Trade and remittances | 38,287 | 30,295 | 38,287 | 30,295 |
| Other financial services | 62,518 | 62,280 | 62,518 | 62,280 |
| Sub total | 627,235 | 548,560 | 627,235 | 548,560 |
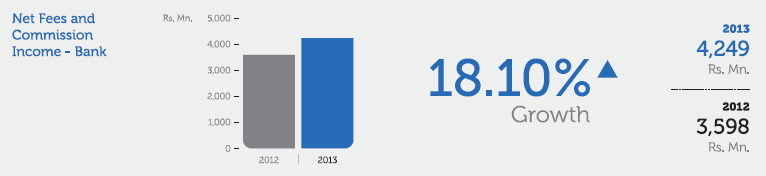
| GROUP | BANK | |||
| 2013 | 2012 | 2013 | 2012 | |
| Rs. ’000 | Rs. ’000 | Rs. ’000 | Rs. ’000 | |
9. Net Gains/(Losses) from Trading |
||||
| Foreign exchange | ||||
| From banks | – | – | – | – |
| From other customers | (1,866,386) | 2,334,295 | (1,866,386) | 2,334,295 |
| Interest rates | ||||
| Net mark to market gains/(losses) | 83,268 | 44,794 | 83,268 | 44,794 |
| Net capital gains/(losses) | 131,488 | 86,374 | 131,488 | 86,374 |
| Equities | ||||
| Net mark to market gains/(losses) | 2,225 | 15,945 | 2,225 | 15,945 |
| Net capital gains/(losses) | 13,644 | 3,864 | 13,644 | 3,864 |
| Dividend income | 9,835 | 9,026 | 9,835 | 9,026 |
| Total | (1,625,926) | 2,494,298 | (1,625,926) | 2,494,298 |
10. Net Gains/(Losses) from Financial Investments
| Financial Investments - Available-for-sale | ||||
| Government securities | 544,903 | – | 544,903 | – |
| Equities | 790,358 | 2,584 | 790,358 | 2,584 |
| Loans and receivables | ||||
| Government securities | – | – | – | – |
| Debt securities | 14,256 | 28,949 | 14,256 | 28,949 |
| Total | 1,349,517 | 31,533 | 1,349,517 | 31,533 |
11. Other Income (Net)
| Gains/(losses) on sale of property, plant & equipment | 11,115 | 10,385 | 233 | (3,866) |
| Gains/(losses) on revaluation of foreign exchange | 3,862,003 | 2,352,716 | 3,862,435 | 2,352,716 |
| Reversal of impairment charges and loans written-off | 2,228,281 | 1,475,232 | 2,228,281 | 1,475,232 |
| Dividend from subsidiaries | – | – | 70,451 | 70,428 |
| Dividend from associates | 2,691 | 8,615 | 2,079 | 8,002 |
| Rental and other income | 218,834 | 199,747 | 209,036 | 134,752 |
| Less: Dividends received from associates transferred to investment | (2,691) | (8,615) | – | – |
| Total | 6,320,233 | 4,038,080 | 6,372,515 | 4,037,264 |
| GROUP | BANK | |||
| 2013 | 2012 | 2013 | 2012 | |
| Rs. ’000 | Rs. ’000 | Rs. ’000 | Rs. ’000 | |
12. Impairment Charges for Loans and Other Losses |
||||
| Loans and receivables | ||||
| To banks [Refer Note 25.2] | – | – | – | – |
| To other customers | 4,600,332 | 3,158,291 | 4,600,332 | 3,158,291 |
| Charge/(write back) to the Income Statement on Individual Impairment [Refer Note 26.2] | 3,021,394 | 1,296,697 | 3,021,394 | 1,296,697 |
| Charge/(write back) to the Income Statement on Collective Impairment [Refer Note 26.2] | 1,479,914 | 1,856,688 | 1,479,914 | 1,856,688 |
| Direct write-offs | 99,024 | 4,906 | 99,024 | 4,906 |
| Investment in subsidiaries [Refer Note 28.1] | – | – | 14,184 | 32,942 |
| Due from subsidiaries | – | – | 12,809 | 5,527 |
| Total | 4,600,332 | 3,158,291 | 4,627,325 | 3,196,760 |
13. Personnel Expenses
| Salary and bonus [Refer Note 13.1] | 6,170,603 | 5,881,820 | 6,108,648 | 5,837,733 |
| Pension costs | ||||
| Contributions to defined contribution/ benefit plans - Funded schemes | 904,919 | 868,352 | 900,844 | 863,018 |
| Contributions to defined benefit plans - Unfunded schemes | 165,791 | 228,793 | 160,113 | 224,390 |
| Other | 1,024,692 | 858,179 | 1,016,600 | 844,647 |
| Total | 8,266,005 | 7,837,144 | 8,186,205 | 7,769,788 |
13.1 Salary and Bonus
Salary and bonus and contributions to defined contribution/benefit plans, reported above includes the amounts paid to and contribution made on behalf of Executive Directors.
14. Other Expenses
| GROUP | BANK | |||
| 2013 | 2012 | 2013 | 2012 | |
| Rs. ’000 | Rs. ’000 | Rs. ’000 | Rs. ’000 | |
| Directors’ emoluments [Refer Note 14.1] | 24,453 | 20,549 | 23,058 | 19,524 |
| Auditors’ remunerations | 22,856 | 21,210 | 19,890 | 17,235 |
| Audit fees and expenses | 10,823 | 11,207 | 8,596 | 7,929 |
| Audit related fee and expenses | 6,654 | 5,631 | 6,405 | 5,230 |
| Non-audit fee and expenses | 5,379 | 4,372 | 4,889 | 4,076 |
| Professional and legal expenses | 251,068 | 280,154 | 305,450 | 275,987 |
| Depreciation of property, plant and equipment [Refer Note 30] | 717,583 | 942,765 | 786,024 | 859,675 |
| Amortisation of leasehold property [Refer Note 32] | 1,452 | 1,452 | 942 | 942 |
| Amortisation of intangible assets [Refer Note 31] | 149,347 | 174,104 | 149,291 | 174,055 |
| Office administration and establishment expenses | 4,140,883 | 3,536,867 | 4,211,399 | 3,663,775 |
| Maintenance of fixed assets | 790,373 | 753,485 | 864,533 | 755,703 |
| Total | 6,098,015 | 5,730,586 | 6,360,587 | 5,766,896 |
14.1 Directors’ Emoluments
Directors emoluments represent the fees paid to both the Executive and Non-Executive Directors of the Bank/Group.
15. Income Tax Expense
15.1 Entity-wise Breakup of the Income Tax Expense
| GROUP | BANK | |||
| 2013 | 2012 | 2013 | 2012 | |
| Rs. ’000 | Rs. ’000 | Rs. ’000 | Rs. ’000 | |
| Bank Current Year Tax expense |
||||
| Current year Income tax expense of Domestic banking unit | 2,869,752 | 3,082,348 | 2,869,752 | 3,082,348 |
| Current year Income tax expense of Off-shore banking centre | 191,760 | 204,960 | 191,760 | 204,960 |
| Current year Income tax expense of Bangladesh operation | 960,937 | 827,480 | 960,937 | 827,480 |
| Profit remittance tax of Bangladesh operation | – | 81,406 | – | 81,406 |
| Prior years | ||||
| Under/(over) provision of taxes in respect of prior years | (161,504) | (140,315) | (161,504) | (140,315) |
| 3,860,945 | 4,055,879 | 3,860,945 | 4,055,879 | |
| Deferred Tax Expense | ||||
| Effect of change in tax rates | – | – | – | – |
| Temporary differences | 204,063 | 141,125 | 204,063 | 141,125 |
| 4,065,008 | 4,197,004 | 4,065,008 | 4,197,004 | |
| Subsidiaries | ||||
| Income tax expense of Commercial Development Company PLC | 46,266 | 25,216 | – | – |
| Income tax expense of ONEzero Company Ltd. | 6,187 | 8,456 | – | – |
| Associates | ||||
| Share of income tax expense of Equity Investments Lanka Ltd. | (33) | 18 | – | – |
| Share of income tax expense of Commercial Insurance Brokers (Pvt) Ltd. | 1,866 | 1,053 | – | – |
| Total income tax expense | 4,119,294 | 4,231,747 | 4,065,008 | 4,197,004 |
| Effective tax rate (excluding deferred tax) | 26.61% | 28.37% | ||
The Bank’s and Subsidiary’s, income tax for 2013 and 2012 have been provided on the taxable income at the rates shown below:
| 2013 | 2012 | |
| % | % | |
| Domestic operations of the Bank | 28.0 | 28.0 |
| Off-shore banking centre of the Bank | 28.0 | 28.0 |
| Bangladesh operation of the Bank | 42.5 | 42.5 |
| Commercial Development Company PLC | 28.0 | 28.0 |
| ONEzero Company Ltd. | 28.0 | 28.0 |
15.2 Notional Tax Credit for Withholding Tax on Government Securities on Secondary Market Transactions
The Inland Revenue Act No. 10 of 2006 and the amendments thereto, provide that a company which derives interest income from the secondary market transactions on Government Securities (on or after April 1, 2002) would be entitled to a notional tax credit (being one-ninth of the net interest income), provided such interest income forms part of statutory income of the Company for that year of assessment.
Accordingly, the net interest income earned by the Group and the Bank from the secondary market transactions in Government Securities for the year, has been grossed up in these Financial Statements and the resulting notional tax credit amounted to Rs. 905.425 Mn. and Rs. 903.649 Mn. respectively (Rs. 331.288 Mn. and Rs. 329.922 Mn. respectively in 2012).
15.3 A Reconciliation between Tax Expense and the Product of Accounting Profit Multiplied by the Statutory Tax Rate:
| Tax Rate | GROUP | BANK | ||||
| 2013 | 2012 | 2013 | 2012 | 2013 | 2012 | |
| % | % | Rs. ’000 | Rs. ’000 | Rs. ’000 | Rs. ’000 | |
| Accounting profit before tax from operations | 14,692,751 | 14,312,914 | 14,510,519 | 14,295,333 | ||
| Tax effect at the statutory income tax rate | 4,430,380 | 4,333,483 | 4,389,700 | 4,300,497 | ||
| Domestic operations of the bank | 28 | 28 | 3,256,166 | 3,287,958 | 3,256,166 | 3,287,958 |
| Operations of the off–shore banking centre of the bank | 28 | 28 | 167,244 | 189,513 | 167,244 | 189,513 |
| Bangladesh operation | 42.5 | 42.5 | 966,290 | 823,026 | 966,290 | 823,026 |
| Subsidiaries | 28 | 28 | 40,680 | 32,986 | – | – |
| Tax effect of exempt income | (887,400) | (574,543) | (887,400) | (574,543) | ||
| Tax effect of non-deductible expenses | 4,359,378 | 4,301,816 | 4,344,749 | 4,279,897 | ||
| Tax effect of deductible expenses | (3,842,137) | (3,919,113) | (3,824,600) | (3,891,063) | ||
| Remittance tax of Bangladesh operation | – | 81,406 | – | 81,406 | ||
| Share of income tax expense of Associates | 1,833 | 1,070 | – | – | ||
| (Over)/under provision of taxes in respect of prior years | (149,266) | (140,243) | (161,504) | (140,315) | ||
| Deferred tax expense [Refer Note 33] | 206,506 | 147,871 | 204,063 | 141,125 | ||
| Income tax expense reported in the income statement at the effective income tax rate | 4,119,294 | 4,231,747 | 4,065,008 | 4,197,004 | ||
16. Earnings Per Share (EPS)
| GROUP | BANK | |||
| 2013 | 2012 | 2013 | 2012 | |
| Amounts used as the numerator: | ||||
| Net profit attributable to equity holders of the Parent (Rs. ’000) | 10,563,378 | 10,079,829 | 10,445,511 | 10,098,329 |
| Profit for the year attributable to equity holders of the Parent for basic and diluted earnings per share (Rs. ’000) | 10,563,378 | 10,079,829 | 10,445,511 | 10,098,329 |
| Number of ordinary shares used as the denominator: | ||||
| Weighted average number of Ordinary shares | 848,528,406 | 832,618,649 | 848,528,406 | 832,618,649 |
| Weighted average number of Ordinary shares for basic earnings per share calculation | 848,528,406 | 832,618,649 | 848,528,406 | 832,618,649 |
| Effect of dilution: | ||||
| Bonus element on number of outstanding options under ESOP 2008 as at the year-end | 1,334,722 | 1,035,169 | 1,334,722 | 1,035,169 |
| Weighted average number of ordinary shares adjusted for the effect of dilution | 849,863,128 | 833,653,818 | 849,863,128 | 833,653,818 |
| Basic earnings per ordinary share (Rs.) | 12.45 | 12.11 | 12.31 | 12.13 |
| Diluted earnings per ordinary share (Rs.) | 12.43 | 12.09 | 12.29 | 12.11 |
17. Dividends
| GROUP | BANK | |||
| 2013 Second Interim Rs. 1.00 Per share for 2012 | 2012 First Interim Rs. 1.50 Per share for 2012 | 2013 Second Interim Rs. 1.00 Per share for 2012 | 2012 First Interim Rs. 1.50 Per share | |
| (Paid during 2013) | (Paid during 2012) | (Paid during 2013) | (Paid during 2012) | |
| Rs. ’000 | Rs. ’000 | Rs. ’000 | Rs. ’000 | |
| On Ordinary Shares | ||||
| Net dividend paid to the ordinary shareholders | 755,339 | 1,132,618 | 755,339 | 1,132,618 |
| Withholding tax deducted at source | 78,270 | 117,543 | 78,270 | 117,543 |
| Gross ordinary dividend paid | 833,609 | 1,250,161 | 833,609 | 1,250,161 |
| First Interim Rs. 1.50 Per share for 2013 | First Interim Rs. 1.50 Per share for 2013 | |||
| (Paid during 2013) | (Paid during 2013) | |||
| Rs. ’000 | Rs. ’000 | |||
| On Ordinary Shares | ||||
| Net dividend paid to the ordinary shareholders | 1,152,615 | – | 1,152,615 | – |
| Withholding tax deducted at source | 120,876 | – | 120,876 | – |
| Gross ordinary dividend paid | 1,273,491 | – | 1,273,491 | – |
| Total Gross ordinary dividend paid | 2,107,100 | 1,250,161 | 2,107,100 | 1,250,161 |
The Bank declared and paid a second interim dividend of Rs. 1.00 per share on January 27, 2014 to both voting and non-voting ordinary shareholders of the Bank. (The second interim dividend for the year 2012 was Rs. 1.00 per share and was paid on February 18, 2013).
The Board of Directors of the Bank have recommended the payment of a final dividend of Rs. 4.00 per share which consist of a cash dividend of Rs. 2.00 per share and the balance entitlement of Rs. 2.00 per share that will be satisfied in the form of issue and allotment of new shares for both the voting and non-voting ordinary shareholders of the Bank for the year ended December 31, 2013 (Bank declared a final dividend of Rs. 4.00 per share in 2012 and this was satisfied by way of Rs. 2.00 per share in the form of cash and Rs. 2.00 per share in the form of shares). The total dividend recommended by the Board is to approved at the forthcoming Annual General Meeting to be held on March 31, 2014. In accordance with provisions of the Sri Lanka Accounting Standard No. 10 on ‘Events after the Reporting Period’, the second interim dividend declared and paid in January 2014 and the proposed final dividend have not been recognised as a liability as at the year-end. Final dividend payable for the year 2013 has been estimated at Rs. 3,396.595 Mn. (Actual final dividend for 2012 amounted to Rs. 3,337.651 Mn.).
18. Classification of Financial Assets and Financial Liabilities
18.1 Classification of Financial Assets and Financial Liabilities - Group
The tables below provide a reconciliation between line items in the Statement of Financial Position and categories of financial assets and financial liabilities of the Group.
18.1 (a) Group - 2013
| Held-for-Trading (HFT) | Amortised Cost | Available-for-Sale (AFS) | Total | ||
| Note | Rs.’000 | Rs.’000 | Rs.’000 | Rs.’000 | |
| Financial Assets | |||||
| Cash and cash equivalents | 20 | – | 14,263,533 | – | 14,263,533 |
| Balances with central banks | 21 | – | 18,431,936 | – | 18,431,936 |
| Placements with banks | 22 | – | 4,131,814 | – | 4,131,814 |
| Derivative financial instruments | 23 | 837,694 | – | – | 837,694 |
| Other financial instruments held-for-trading | 24 | 6,379,058 | – | – | 6,379,058 |
| Loans and receivables to banks | 25 | – | 546,270 | – | 546,270 |
| Loans and receivables to other customers | 26 | – | 418,944,215 | – | 418,944,215 |
| Financial investments - Available-for-sale | 27 | – | – | 123,748,290 | 123,748,290 |
| Total financial assets | 7,216,752 | 456,317,768 | 123,748,290 | 587,282,810 | |
| Financial Liabilities | |||||
| Due to banks | 35 | – | 14,194,219 | – | 14,194,219 |
| Derivative financial instruments | 36 | 1,411,916 | – | – | 1,411,916 |
| Due to other customers | 37 | – | 451,098,946 | – | 451,098,946 |
| Other borrowings | 38 | – | 53,997,503 | – | 53,997,503 |
| Subordinated liabilities | 42 | – | 11,056,847 | – | 11,056,847 |
| Total financial liabilities | 1,411,916 | 530,347,515 | – | 531,759,431 |
18.1 (b) Group - 2012
| Held-for-Trading (HFT) | Amortised Cost | Available-for-Sale (AFS) | Total | ||
| Note | Rs. ’000 | Rs. ’000 | Rs. ’000 | Rs. ’000 | |
| Financial Assets | |||||
| Cash and cash equivalents | 20 | – | 19,752,205 | – | 19,752,205 |
| Balances with central banks | 21 | – | 18,168,039 | – | 18,168,039 |
| Placements with banks | 22 | – | 16,162,970 | – | 16,162,970 |
| Derivative financial instruments | 23 | 1,351,095 | – | – | 1,351,095 |
| Other financial instruments held-for-trading | 24 | 6,041,110 | – | – | 6,041,110 |
| Loans and receivables to banks | 25 | – | 628,760 | – | 628,760 |
| Loans and receivables to other customers | 26 | – | 372,857,337 | – | 372,857,337 |
| Financial investments - Available-for-sale | 27 | – | – | 57,963,192 | 57,963,192 |
| Total financial assets | 7,392,205 | 427,569,311 | 57,963,192 | 492,924,708 | |
| Financial Liabilities | |||||
| Due to banks | 35 | – | 4,893,945 | – | 4,893,945 |
| Derivative financial instruments | 36 | 84,291 | – | – | 84,291 |
| Due to other customers | 37 | – | 390,568,682 | – | 390,568,682 |
| Other borrowings | 38 | – | 47,435,565 | – | 47,435,565 |
| Subordinated liabilities | 42 | – | 1,106,016 | – | 1,106,016 |
| Total financial liabilities | 84,291 | 444,004,208 | – | 444,088,499 |
18.2 Classification of Financial Assets and Financial Liabilities - Bank
The tables below provide a reconciliation between line items in the Statement of Financial Position and categories of financial assets and financial liabilities of the Bank.
18.2 (a) Bank - 2013
| Held-for-Trading (HFT) | Amortised Cost | Available-for-Sale (AFS) | Total | ||
| Note | Rs. ’000 | Rs. ’000 | Rs. ’000 | Rs. ’000 | |
| Financial Assets | |||||
| Cash and cash equivalents | 20 | – | 14,261,549 | – | 14,261,549 |
| Balances with central banks | 21 | – | 18,431,936 | – | 18,431,936 |
| Placements with banks | 22 | – | 4,131,814 | – | 4,131,814 |
| Derivative financial instruments | 23 | 837,694 | – | – | 837,694 |
| Other financial instruments held-for-trading | 24 | 6,379,058 | – | – | 6,379,058 |
| Loans and receivables to banks | 25 | – | 546,270 | – | 546,270 |
| Loans and receivables to other customers | 26 | – | 418,959,675 | – | 418,959,675 |
| Financial investments - Available-for-sale | 27 | – | – | 123,748,290 | 123,748,290 |
| Total financial assets | 7,216,752 | 456,331,244 | 123,748,290 | 587,296,286 | |
| Financial Liabilities | |||||
| Due to banks | 35 | – | 14,194,219 | – | 14,194,219 |
| Derivative financial instruments | 36 | 1,411,916 | – | – | 1,411,916 |
| Due to other customers | 37 | – | 451,152,923 | – | 451,152,923 |
| Other borrowings | 38 | – | 54,173,175 | – | 54,173,175 |
| Subordinated liabilities | 42 | – | 11,056,847 | – | 11,056,847 |
| Total financial liabilities | 1,411,916 | 530,577,164 | – | 531,989,080 |
18.2 (b) Bank - 2012
| Held-for-Trading (HFT) | Amortised Cost | Available-for-Sale (AFS) | Total | ||
| Note | Rs. ’000 | Rs. ’000 | Rs. ’000 | Rs. ’000 | |
| Financial Assets | |||||
| Cash and cash equivalents | 20 | – | 19,732,834 | – | 19,732,834 |
| Balances with central banks | 21 | – | 18,168,039 | – | 18,168,039 |
| Placements with banks | 22 | – | 16,162,970 | – | 16,162,970 |
| Derivative financial instruments | 23 | 1,351,095 | – | – | 1,351,095 |
| Other financial instruments held-for-trading | 24 | 6,041,110 | – | – | 6,041,110 |
| Loans and receivables to banks | 25 | – | 628,760 | – | 628,760 |
| Loans and receivables to other customers | 26 | – | 372,915,081 | – | 372,915,081 |
| Financial investments - Available-for-sale | 27 | – | – | 57,963,192 | 57,963,192 |
| Total financial assets | 7,392,205 | 427,607,684 | 57,963,192 | 492,963,081 | |
| Financial Liabilities | |||||
| Due to banks | 35 | – | 4,893,945 | – | 4,893,945 |
| Derivative financial instruments | 36 | 84,291 | – | – | 84,291 |
| Due to other customers | 37 | – | 390,611,548 | – | 390,611,548 |
| Other borrowings | 38 | – | 47,582,819 | – | 47,582,819 |
| Subordinated liabilities | 42 | – | 1,106,016 | – | 1,106,016 |
| Total financial liabilities | 84,291 | 444,194,328 | – | 444,278,619 |
19. Fair Values of Financial Instruments
Financial Instruments Measured at Fair Value - Fair Value Hierarchy
The table below analyses financial instruments measured at fair value at the reporting date, by the level in the fair value hierarchy into which the fair value measurement is categorised. The amounts are based on the values recognised in the Statement of Financial Position.
| GROUP | BANK | ||||||||
| Level 1 | Level 2 | Level 3 | Total | Level 1 | Level 2 | Level 3 | Total | ||
| Note | Rs. ’000 | Rs. ’000 | Rs. ’000 | Rs. ’000 | Rs. ’000 | Rs. ’000 | Rs. ’000 | Rs. ’000 | |
| As at December 31, 2013 | |||||||||
| Assets | |||||||||
| Derivative financial instruments | 23 | 837,694 | 837,694 | 837,694 | 837,694 | ||||
| Other financial instruments held-for-trading | 24 | 6,379,058 | 6,379,058 | 6,379,058 | 6,379,058 | ||||
| Financial investments - Available-for-sale* | 27 | 123,703,198 | 123,703,198 | 123,703,198 | 123,703,198 | ||||
| Total assets at fair value | 130,082,256 | 837,694 | – | 130,919,950 | 130,082,256 | 837,694 | – | 130,919,950 | |
| Liabilities | |||||||||
| Derivative financial instruments | 36 | 1,411,916 | 1,411,916 | 1,411,916 | 1,411,916 | ||||
| Total liabilities at fair value | – | 1,411,916 | – | 1,411,916 | – | 1,411,916 | – | 1,411,916 | |
| As at December 31, 2012 | |||||||||
| Assets | |||||||||
| Derivative financial instruments | 23 | 1,351,095 | 1,351,095 | 1,351,095 | 1,351,095 | ||||
| Other financial instruments held-for-trading | 24 | 6,041,110 | 6,041,110 | 6,041,110 | 6,041,110 | ||||
| Financial investments - Available-for-sale* | 27 | 57,927,513 | 57,927,513 | 57,927,513 | 57,927,513 | ||||
| Total assets at fair value | 63,968,623 | 1,351,095 | – | 65,319,718 | 63,968,623 | 1,351,095 | – | 65,319,718 | |
| Liabilities | |||||||||
| Derivative financial instruments | 36 | 84,291 | 84,291 | 84,291 | 84,291 | ||||
| Total liabilities at fair value | – | 84,291 | – | 84,291 | – | 84,291 | – | 84,291 | |
* Unquoted share value of Rs. 45.092 Mn., in Group and Bank for the year 2013 (for the year 2012 was Rs. 35.679 Mn.) categorised under Financial Investments - Available-for-sale in the Statement of Financial Position has not been considered for above note due to non-availability of reliable market values.
19.1 Fair Value of Financial Assets not Carried at Fair Value
Financial assets not carried at fair value are disclosed under the category Amortised Cost. The values reported under Amortised Cost category are comparable to their fair value.
| GROUP | BANK | |||
| 2013 | 2012 | 2013 | 2012 | |
| Rs. ’000 | Rs. ’000 | Rs. ’000 | Rs. ’000 | |
20. Cash and Cash Equivalents |
||||
| Cash in hand | ||||
| Coins and notes held in local currency | 9,643,069 | 9,993,872 | 9,641,519 | 9,974,501 |
| Coins and notes held in foreign currency | 1,866,981 | 1,100,258 | 1,866,547 | 1,100,258 |
| Balances with banks | 2,635,082 | 4,140,608 | 2,635,082 | 4,140,608 |
| Money at call and short notice | 118,401 | 4,517,467 | 118,401 | 4,517,467 |
| Total | 14,263,533 | 19,752,205 | 14,261,549 | 19,732,834 |
| GROUP | BANK | |||
| 2013 | 2012 | 2013 | 2012 | |
| Rs. ’000 | Rs. ’000 | Rs. ’000 | Rs. ’000 | |
21. Balances with Central Banks |
||||
| Statutory balances with central banks | ||||
| Central Bank of Sri Lanka | 15,449,704 | 15,786,899 | 15,449,704 | 15,786,899 |
| Bangladesh Bank | 2,982,232 | 2,381,140 | 2,982,232 | 2,381,140 |
| Non-statutory balances with central banks | ||||
| Central Bank of Sri Lanka | – | – | – | – |
| Bangladesh Bank | – | – | – | – |
| Total | 18,431,936 | 18,168,039 | 18,431,936 | 18,168,039 |
As required by the provisions of Section 93 of the Monetary Law Act, a cash balance is maintained with the Central Bank of Sri Lanka. As at December 31, 2013, the minimum cash reserve requirement was 6.00% of the rupee deposit liabilities (8.00% in 2012). There is no reserve requirement for foreign currency deposit liabilities of the Domestic Banking Unit and the deposit liabilities of the Off-shore Banking Centre in Sri Lanka.
As per the Bangladesh Bank regulations, the Statutory Liquidity Requirement as at December 31, 2013 was 19.00% (19.00% in 2012) on time and demand liabilities (both local and foreign currencies), which includes a 6.00% (6.00% in 2012) cash reserve requirement and the balance 13.00% is permitted to be maintained in foreign currency and/or also in unencumbered securities held with the Bangladesh Bank.
| GROUP | BANK | |||
| 2013 | 2012 | 2013 | 2012 | |
| Rs. ’000 | Rs. ’000 | Rs. ’000 | Rs. ’000 | |
22. Placements with Banks |
||||
| Placements - Within Sri Lanka | – | 3,584,000 | – | 3,584,000 |
| Placements - Outside Sri Lanka | 4,131,814 | 12,578,970 | 4,131,814 | 12,578,970 |
| Total | 4,131,814 | 16,162,970 | 4,131,814 | 16,162,970 |
23. Derivative Financial Instruments
| Interest rate derivatives | ||||
| Interest rate swaps | – | – | – | – |
| Foreign currency derivatives | ||||
| Forward foreign exchange contracts | 837,694 | 1,351,095 | 837,694 | 1,351,095 |
| Total | 837,694 | 1,351,095 | 837,694 | 1,351,095 |
| GROUP | BANK | |||
| 2013 | 2012 | 2013 | 2012 | |
| Rs. ’000 | Rs. ’000 | Rs. ’000 | Rs. ’000 | |
24. Other Financial Instruments Held-for-Trading |
||||
| Government Securities [Refer Note 24.1] | 6,044,651 | 5,718,231 | 6,044,651 | 5,718,231 |
| Equity shares [Refer Note 24.2] | 334,407 | 322,879 | 334,407 | 322,879 |
| Total | 6,379,058 | 6,041,110 | 6,379,058 | 6,041,110 |
24.1 Government Securities
| Treasury bills | 4,788,578 | 4,175,815 | 4,788,578 | 4,175,815 |
| Treasury bonds | 1,256,073 | 1,542,416 | 1,256,073 | 1,542,416 |
| Sub total | 6,044,651 | 5,718,231 | 6,044,651 | 5,718,231 |
24.2 Equity Shares
| GROUP | BANK | |||||||
| As at December 31, 2013 | As at December 31, 2012 | As at December 31, 2013 | As at December 31, 2012 | |||||
| Cost | Market Value | Cost | Market Value | Cost | Market Value | Cost | Market Value | |
| Rs. ’000 | Rs. ’000 | Rs. ’000 | Rs. ’000 | Rs. ’000 | Rs. ’000 | Rs. ’000 | Rs. ’000 | |
| Quoted: | ||||||||
| Shares | ||||||||
| Tokyo Cement Company (Lanka) PLC | 15,502 | 13,772 | 15,502 | 10,326 | 15,502 | 13,772 | 15,502 | 10,326 |
| (588,555 Non-Voting Ordinary Shares) | (@ Rs. 23.40) | (@ Rs. 19.30) | (@ Rs. 23.40) | (@ Rs. 19.30) | ||||
| (535,050 Non-Voting Ordinary Shares as at December 31, 2012) | ||||||||
| Dipped Products PLC | 24,239 | 18,000 | 24,239 | 22,000 | 24,239 | 18,000 | 24,239 | 22,000 |
| (200,000 Ordinary Shares) | (@ Rs. 90.00) | (@ Rs. 110.00) | (@ Rs. 90.00) | (@ Rs. 110.00) | ||||
| (200,000 Ordinary Shares as at December 31, 2012) | ||||||||
| Lanka IOC PLC | 15,013 | 22,706 | 6,740 | 7,020 | 15,013 | 22,706 | 6,740 | 7,020 |
| (685,984 Ordinary Shares) | (@ Rs. 33.10) | (@ Rs. 19.50) | (@ Rs. 33.10) | (@ Rs. 19.50) | ||||
| (360,009 Ordinary Shares as at December 31, 2012) | ||||||||
| Dialog Axiata PLC | 15,193 | 18,984 | 19,243 | 24,063 | 15,193 | 18,984 | 19,243 | 24,063 |
| (2,109,322 Ordinary Shares) | (@ Rs. 9.00) | (@ Rs. 8.30) | (@ Rs. 9.00) | (@ Rs. 8.30) | ||||
| (2,899,098 Ordinary Shares as at December 31, 2012) | ||||||||
| ACL Cables PLC | 14,096 | 11,131 | 10,288 | 8,176 | 14,096 | 11,131 | 10,288 | 8,176 |
| (171,516 Ordinary Shares) | (@ Rs. 64.90) | (@ Rs. 67.40) | (@ Rs. 64.90) | (@ Rs. 67.40) | ||||
| (121,300 Ordinary Shares as at December 31, 2012) | ||||||||
| Pelwatte Sugar Industries PLC | 351 | 1 | 351 | 289 | 351 | 1 | 351 | 289 |
| (12,300 Ordinary Shares) | (@ Rs. 0.10) | (@ Rs. 23.50) | (@ Rs. 0.10) | (@ Rs. 23.50) | ||||
| (12,300 Ordinary Shares as at December 31, 2012) | ||||||||
| Overseas Reality Ceylon PLC | 2,512 | 3,184 | 2,512 | 2,506 | 2,512 | 3,184 | 2,512 | 2,506 |
| (174,000 Ordinary Shares) | (@ Rs. 18.30) | (@ Rs. 14.40) | (@ Rs. 18.30) | (@ Rs. 14.40) | ||||
| (174,000 Ordinary Shares as at December 31, 2012) | ||||||||
| Distilleries Company of Sri Lanka PLC | 44,929 | 54,328 | 69,341 | 71,449 | 44,929 | 54,328 | 69,341 | 71,449 |
| (281,490 Ordinary Shares) | (@ Rs. 193.00) | (@ Rs. 166.00) | (@ Rs. 193.00) | (@ Rs. 166.00) | ||||
| (430,417 Ordinary Shares as at December 31, 2012) | ||||||||
| Lanka Milk Foods (CWE) PLC | 27,866 | 26,325 | 27,866 | 25,000 | 27,866 | 26,325 | 27,866 | 25,000 |
| (250,000 Ordinary Shares) | (@ Rs. 105.30) | (@ Rs. 100.00) | (@ Rs. 105.30) | (@ Rs. 100.00) | ||||
| (250,000 Ordinary Shares as at December 31, 2012) | ||||||||
| Chemical Industries Colombo PLC | 11,692 | 5,568 | 11,692 | 8,909 | 11,692 | 5,568 | 11,692 | 8,909 |
| (161,400 Non-Voting Ordinary Shares) | (@ Rs. 34.50) | (@ Rs. 55.20) | (@ Rs. 34.50) | (@ Rs. 55.20) | ||||
| (161,400 Non-Voting Ordinary Shares as at December 31, 2012) | ||||||||
| Haycarb PLC | 15,914 | 20,328 | 31,748 | 35,070 | 15,914 | 20,328 | 31,748 | 35,070 |
| (107,100 Ordinary Shares) | (@ Rs. 189.80) | (@ Rs. 171.10) | (@ Rs. 189.80) | (@ Rs. 171.10) | ||||
| (204,968 Ordinary Shares as at December 31, 2012) | ||||||||
| Ceylon Hospitals PLC | 16,665 | 17,259 | 16,665 | 14,435 | 16,665 | 17,259 | 16,665 | 14,435 |
| (156,900 Ordinary Shares ) | (@ Rs. 110.00) | (@ Rs. 92.00) | (@ Rs. 110.00) | (@ Rs. 92.00) | ||||
| (156,900 Ordinary Shares as at December 31, 2012) | ||||||||
| Ceylon Hospitals PLC | 4,423 | 4,583 | 4,423 | 4,094 | 4,423 | 4,583 | 4,423 | 4,094 |
| (61,100 Non-Voting Ordinary Shares) | (@ Rs. 75.00) | (@ Rs. 67.00) | (@ Rs. 75.00) | (@ Rs. 67.00) | ||||
| (61,100 Non-Voting Ordinary Shares as at December 31, 2012) | ||||||||
| Lanka Walltile PLC | 5 | 3 | 5 | 4 | 5 | 3 | 5 | 4 |
| (60 Ordinary Shares) | (@ Rs. 53.90) | (@ Rs. 60.80) | (@ Rs. 53.90) | (@ Rs. 60.80) | ||||
| (60 Ordinary Shares as at December 31, 2012) | ||||||||
| Kotagala Plantations PLC | 9,172 | 7,465 | 156 | 104 | 9,172 | 7,465 | 156 | 104 |
| (201,750 Ordinary Shares) | (@ Rs. 37.00) | (@ Rs. 74.00) | (@ Rs. 37.00) | (@ Rs. 74.00) | ||||
| (1,400 Ordinary Shares as at December 31, 2012) | ||||||||
| Royal Ceramics Lanka PLC | 30,676 | 22,410 | 7,772 | 5,445 | 30,676 | 22,410 | 7,772 | 5,445 |
| (264,896 Ordinary Shares) | (@ Rs. 84.60) | (@ Rs. 99.00) | (@ Rs. 84.60) | (@ Rs. 99.00) | ||||
| (55,000 Ordinary Shares as at December 31, 2012) | ||||||||
| COCO Lanka PLC | 7,062 | 6,633 | 7,062 | 7,316 | 7,062 | 6,633 | 7,062 | 7,316 |
| (402,000 Ordinary Shares) | (@ Rs. 16.50) | (@ Rs. 36.40) | (@ Rs. 16.50) | (@ Rs. 36.40) | ||||
| (201,000 - Ordinary Shares as at December 31, 2012) | ||||||||
| COCO Lanka PLC | 15 | 13 | 15 | 15 | 15 | 13 | 15 | 15 |
| (1,000 Non-Voting Ordinary Shares) | (@ Rs. 13.10) | (@ Rs. 29.50) | (@ Rs. 13.10) | (@ Rs. 29.50) | ||||
| (500 Non-Voting Ordinary Shares as at December 31, 2012) | ||||||||
| Citizen Development Bank PLC | 4,130 | 4,413 | 4,130 | 3,719 | 4,130 | 4,413 | 4,130 | 3,719 |
| (123,950 Non-Voting Ordinary Shares) | (@ Rs. 35.60) | (@ Rs. 30.00) | (@ Rs. 35.60) | (@ Rs. 30.00) | ||||
| (123,950 Non-Voting Ordinary Shares as at December 31, 2012) | ||||||||
| Lanka Venture PLC | 3,033 | 4,100 | 3,033 | 3,200 | 3,033 | 4,100 | 3,033 | 3,200 |
| (100,000 Ordinary Shares) | (@ Rs. 41.00) | (@ Rs. 32.00) | (@ Rs. 41.00) | (@ Rs. 32.00 ) | ||||
| (100,000 Ordinary Shares as at December 31, 2012) | ||||||||
| Renuka Holdings PLC | 2,477 | 2,070 | 2,477 | 2,450 | 2,477 | 2,070 | 2,477 | 2,450 |
| (100,000 Non-Voting Ordinary Shares) | (@ Rs. 20.70) | (@ Rs. 24.50) | (@ Rs. 20.70) | (@ Rs. 24.50) | ||||
| (100,000 Non-Voting Ordinary Shares as at December 31, 2012) | ||||||||
| Renuka Holdings PLC | 1,770 | 1,530 | 1,770 | 1,805 | 1,770 | 1,530 | 1,770 | 1,805 |
| (50,000 Ordinary Shares) | (@ Rs. 30.60) | (@ Rs. 36.10) | (@ Rs. 30.60) | (@ Rs. 36.10) | ||||
| (50,000 Ordinary Shares as at December 31, 2012) | ||||||||
| Hemas Power PLC | 6,748 | 5,925 | 4,622 | 4,864 | 6,748 | 5,925 | 4,622 | 4,864 |
| (336,657 Ordinary Shares) | (@ Rs. 17.60) | (@ Rs. 21.90) | (@ Rs. 17.60) | (@ Rs. 21.90) | ||||
| (222,100 Ordinary Shares as at December 31, 2012) | ||||||||
| Hatton National Bank PLC | 12 | 12 | 29,925 | 30,728 | 12 | 12 | 29,925 | 30,728 |
| (82 Ordinary Shares) | (@ Rs. 147.00) | (@ Rs. 148.00) | (@ Rs. 147.00) | (@ Rs. 148.00) | ||||
| (207,623 Ordinary Shares as at December 31, 2012) | ||||||||
| Property Developments Ltd. | 4,693 | 5,494 | 4,693 | 3,929 | 4,693 | 5,494 | 4,693 | 3,929 |
| (83,235 Ordinary Shares) | (@ Rs. 66.00) | (@ Rs. 47.20) | (@ Rs. 66.00) | (@ Rs. 47.20) | ||||
| (83,235 Ordinary Shares as at December 31, 2012) | ||||||||
| Nations Trust Bank PLC | 16,238 | 16,316 | – | – | 16,238 | 16,316 | – | – |
| (262,314 Ordinary Shares) | (@ Rs. 62.20) | – | – | (@ Rs. 62.20) | – | – | ||
| (2012- Nil) | ||||||||
| Colombo Dockyard PLC | 16,685 | 14,220 | – | – | 16,685 | 14,220 | – | – |
| (75,000 Ordinary Shares) | (@ Rs. 189.60) | – | – | (@ Rs. 189.60) | – | – | ||
| (2012 - Nil) | ||||||||
| Hemas Holdings PLC | 23,242 | 21,616 | – | – | 23,242 | 21,616 | – | – |
| (635,750 Ordinary Shares) | (@ Rs. 34.00) | – | – | (@ Rs. 34.00) | – | – | ||
| (2012 - Nil) | ||||||||
| Sampath Bank PLC | 4,298 | 4,298 | – | – | 4,298 | 4,298 | – | – |
| (25,000 Ordinary Shares) | (@ Rs. 171.90) | – | – | (@ Rs. 171.90) | – | – | ||
| (2012 - Nil) | ||||||||
| John Keells Hotels PLC | 1,638 | 1,720 | – | – | 1,638 | 1,720 | – | – |
| (137,608 Ordinary Shares) | (@ Rs. 12.50) | – | – | (@ Rs. 12.50) | – | – | ||
| (2012 - Nil) | ||||||||
| NDB Bank PLC | – | – | 13,348 | 13,790 | – | – | 13,348 | 13,790 |
| (2013 - Nil) | – | – | (@ Rs. 137.90) | – | – | (@ Rs. 137.90) | ||
| (100,000 Ordinary Shares as at December 31, 2012) | ||||||||
| Hatton National Bank PLC | – | – | 5,013 | 6,031 | – | – | 5,013 | 6,031 |
| (2013 - Nil) | – | – | (@ Rs. 112.50) | – | – | (@ Rs. 112.50) | ||
| (53,608 Ordinary Shares as at December 31, 2012) | ||||||||
| DFCC Bank PLC | – | – | 6,353 | 6,142 | – | – | 6,353 | 6,142 |
| (2013 - Nil) | – | – | (@ Rs. 112.90) | – | – | (@ Rs. 112.90) | ||
| (54,400 Ordinary Shares as at December 31, 2012) | ||||||||
| Sub total | 340,289 | 334,407 | 330,984 | 322,879 | 340,289 | 334,407 | 330,984 | 322,879 |
| Mark to market gains/(losses) | (5,882) | (8,105) | (5,882) | (8,105) | ||||
| Total | 334,407 | 334,407 | 322,879 | 322,879 | 334,407 | 334,407 | 322,879 | 322,879 |
| GROUP | BANK | |||||||
| As at December 31, 2013 | As at December 31, 2012 | As at December 31, 2013 | As at December 31, 2012 | |||||
| Cost | Market Value | Cost | Market Value | Cost | Market Value | Cost | Market Value | |
| Rs. ’000 | Rs. ’000 | Rs. ’000 | Rs. ’000 | Rs. ’000 | Rs. ’000 | Rs. ’000 | Rs. ’000 | |
24.3 Equity Shares - Composition |
||||||||
| Banks | 24,678 | 25,039 | 58,769 | 60,410 | 24,678 | 25,039 | 58,769 | 60,410 |
| Corporate Entities | 315,611 | 309,368 | 272,215 | 262,469 | 315,611 | 309,368 | 272,215 | 262,469 |
| Sub total | 340,289 | 334,407 | 330,984 | 322,879 | 340,289 | 334,407 | 330,984 | 322,879 |
| Add/(less): Mark to market gains/(losses) | (5,882) | – | (8,105) | – | (5,882) | – | (8,105) | – |
| Total | 334,407 | 334,407 | 322,879 | 322,879 | 334,407 | 334,407 | 322,879 | 322,879 |
| GROUP | BANK | |||
| 2013 | 2012 | 2013 | 2012 | |
| Rs. ’000 | Rs. ’000 | Rs. ’000 | Rs. ’000 | |
25. Loans and Receivables to Banks |
||||
| Gross loans and receivables | 546,270 | 628,760 | 546,270 | 628,760 |
| Less: Provision for impairment [Refer Note 25.2] | – | – | – | – |
| Net loans and receivables | 546,270 | 628,760 | 546,270 | 628,760 |
25.1 Analysis
25.1 (a) By product
| Loans and advances | ||||
| Overdrafts | – | – | – | – |
| Short-term loans | – | – | – | – |
| Long-term loans | – | – | – | – |
| Reverse repo agreements | – | – | – | – |
| Others | ||||
| Sri Lanka Government Securities | – | – | – | – |
| Investments [Refer Note 25.3] | – | 95,000 | – | 95,000 |
| Others (*) | 546,270 | 533,760 | 546,270 | 533,760 |
| Total | 546,270 | 628,760 | 546,270 | 628,760 |
(*) The Bank did not make payments to counterparty banks for the oil hedging transactions with effect from June 2, 2009 in response to a Directive received from the Exchange Controller of the Central Bank of Sri Lanka. Consequently, one of the counterparty banks appropriated US$ 4.170 Mn. (Rs. 546.270 Mn.) which was kept as a deposit with them. This action has been contested by the Bank. In view of the stance taken by the Bank in this regard, both the deposit (made by the Bank) and the amount due to the said counterparty bank have been recorded in the Statement of Financial Position.
| GROUP | BANK | |||
| 2013 | 2012 | 2013 | 2012 | |
| Rs. ’000 | Rs. ’000 | Rs. ’000 | Rs. ’000 | |
25.1 (b) By currency |
||||
| Sri Lankan Rupee | – | 95,000 | – | 95,000 |
| United States Dollar | 546,270 | 533,760 | 546,270 | 533,760 |
| Great Britain Pound | – | – | – | – |
| Bangladesh Taka | – | – | – | – |
| Other currencies | – | – | – | – |
| Total | 546,270 | 628,760 | 546,270 | 628,760 |
25.2 Movement in Provision for Impairment |
||||
| Opening balance | – | – | – | – |
| Charge/(write back) to the Income Statement | – | – | – | – |
| Write-off during the year | – | – | – | – |
| Other movements | – | – | – | – |
| Closing balance | – | – | – | – |
25.3 Investments
| GROUP | BANK | |||||||
| As at December 31, 2013 | As at December 31, 2012 | As at December 31, 2013 | As at December 31, 2012 | |||||
| Cost | Market Value | Cost | Market Value | Cost | Market Value | Cost | Market Value | |
| Rs. ’000 | Rs. ’000 | Rs. ’000 | Rs. ’000 | Rs. ’000 | Rs. ’000 | Rs. ’000 | Rs. ’000 | |
| Nations Trust Bank PLC (20.53% - 2013) | – | – | 95,000 | 95,000 | – | – | 95,000 | 95,000 |
| (2013 - Nil) | (@ Rs. 1,000.00) | (@ Rs. 1,000.00) | ||||||
| (95,000 Debentures as at December 31, 2012) | ||||||||
| Total | – | – | 95,000 | 95,000 | – | – | 95,000 | 95,000 |
26. Loans and Receivables to Other Customers
| GROUP | BANK | |||
| 2013 | 2012 | 2013 | 2012 | |
| Rs. ’000 | Rs. ’000 | Rs. ’000 | Rs. ’000 | |
| Gross loans and receivables [Refer Note 26.1] | 434,731,383 | 386,358,564 | 434,746,843 | 386,416,308 |
| Less: Provision for individual impairment [Refer Note 26.2] | 4,204,654 | 3,402,168 | 4,204,654 | 3,402,168 |
| Provision for collective impairment [Refer Note 26.2] | 11,582,514 | 10,099,059 | 11,582,514 | 10,099,059 |
| Net loans and receivables | 418,944,215 | 372,857,337 | 418,959,675 | 372,915,081 |
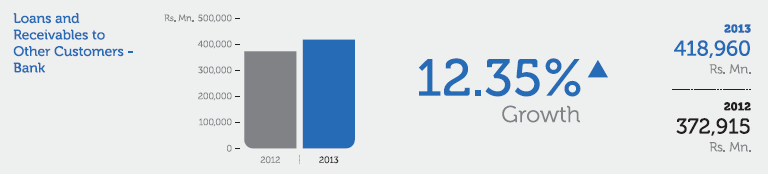
| GROUP | BANK | |||
| 2013 | 2012 | 2013 | 2012 | |
| Rs. ’000 | Rs. ’000 | Rs. ’000 | Rs. ’000 | |
26.1 Analysis |
||||
26.1 (a) By product |
||||
| Loans and advances | ||||
| Overdrafts | 72,420,675 | 69,476,949 | 72,420,675 | 69,477,242 |
| Trade finance | 47,957,137 | 39,006,056 | 47,957,137 | 39,006,056 |
| Lease receivable [Refer Note 26.3] | 21,778,745 | 25,188,248 | 21,795,710 | 25,245,649 |
| Credit cards | 3,999,619 | 2,779,375 | 3,999,619 | 2,779,375 |
| Pawning | 6,995,603 | 10,947,448 | 6,995,603 | 10,947,448 |
| Staff loans | 3,885,911 | 3,175,953 | 3,885,911 | 3,175,953 |
| Housing loans | 27,729,953 | 25,466,504 | 27,729,953 | 25,466,504 |
| Personal loans | 16,517,343 | 18,016,009 | 16,517,343 | 18,016,009 |
| Term loans | ||||
| Short-term | 30,636,267 | 29,144,209 | 30,636,267 | 29,144,259 |
| Long-term | 133,326,027 | 111,155,039 | 133,324,522 | 111,155,039 |
| Bills of Exchange | 5,043,658 | 5,685,865 | 5,043,658 | 5,685,865 |
| Securities purchased under resale agreements | 8,946,499 | 3,697,682 | 8,946,499 | 3,697,682 |
| Sub total | 379,237,437 | 343,739,337 | 379,252,897 | 343,797,081 |
| Others | ||||
| Government securities [Refer Note 26.5] | 51,116,932 | 39,283,936 | 51,116,932 | 39,283,936 |
| Investments [Refer Note 26.6] | 4,377,014 | 3,335,291 | 4,377,014 | 3,335,291 |
| Sub total | 55,493,946 | 42,619,227 | 55,493,946 | 42,619,227 |
| Total of gross loans and receivables | 434,731,383 | 386,358,564 | 434,746,843 | 386,416,308 |
26.1 (b) By currency
| Sri Lanka Rupee | 314,608,021 | 285,107,232 | 314,623,481 | 285,164,976 |
| United States Dollar | 78,911,348 | 69,930,980 | 78,911,348 | 69,930,980 |
| Great Britain Pound | 871,965 | 525,914 | 871,965 | 525,914 |
| Euro currency | 1,466,964 | 867,484 | 1,466,964 | 867,484 |
| Australian Dollar | 46,234 | 105,795 | 46,234 | 105,795 |
| Japanese Yen | 613 | 12,111 | 613 | 12,111 |
| Singapore Dollar | 5,127 | 715 | 5,127 | 715 |
| Bangladesh Taka | 38,821,111 | 29,779,782 | 38,821,111 | 29,779,782 |
| Other Currencies | – | 28,551 | – | 28,551 |
| Sub total | 434,731,383 | 386,358,564 | 434,746,843 | 386,416,308 |
| GROUP | BANK | |||
| 2013 | 2012 | 2013 | 2012 | |
| Rs. ’000 | Rs. ’000 | Rs. ’000 | Rs. ’000 | |
26.1 (c) By Industry (*) |
||||
| Agriculture and fishing | 38,013,743 | 37,799,861 | 38,013,743 | 37,799,861 |
| Manufacturing | 49,650,801 | 43,557,515 | 49,650,801 | 43,557,515 |
| Tourism | 14,242,671 | 12,203,840 | 14,242,671 | 12,203,840 |
| Transport | 10,157,863 | 5,665,451 | 10,174,829 | 5,665,451 |
| Construction | 35,601,502 | 29,425,050 | 35,601,502 | 29,425,050 |
| Traders | 52,367,237 | 49,426,885 | 52,367,237 | 49,426,885 |
| New economy | 6,440,151 | 5,456,003 | 6,440,151 | 5,456,003 |
| Financial and business services | 16,415,452 | 15,112,163 | 16,415,452 | 15,112,163 |
| Infrastructure | 12,814,953 | 6,917,962 | 12,814,953 | 6,917,962 |
| Other services | 30,420,543 | 27,135,490 | 30,420,543 | 27,135,490 |
| Other customers | 113,112,521 | 111,039,117 | 113,111,015 | 111,096,861 |
| Sub total | 379,237,437 | 343,739,337 | 379,252,897 | 343,797,081 |
(*) Industry-wise breakdown is provided only for loans and advances.
26.2 Movement in Provision for Individual and Collective Impairment during the Year
| Movement in Provision for Individual Impairment | ||||
| Opening balance | 3,402,168 | 3,363,859 | 3,402,168 | 3,363,859 |
| Charge/(write back) to the income statement | 3,021,394 | 1,296,697 | 3,021,394 | 1,296,697 |
| Net write-off/(recoveries) during the year | (2,320,881) | (1,491,247) | (2,320,881) | (1,491,247) |
| Exchange rate variance on foreign currency provisions | 18,792 | 14,807 | 18,792 | 14,807 |
| Interest accrued/(reversals) on impaired loans and advances | (304,712) | (249,760) | (304,712) | (249,760) |
| Other movements | 387,893 | 467,812 | 387,893 | 467,812 |
| Closing balance | 4,204,654 | 3,402,168 | 4,204,654 | 3,402,168 |
| Movement in Provision for Collective Impairment | ||||
| Opening balance | 10,099,059 | 8,237,033 | 10,099,059 | 8,237,033 |
| Charge/(write back) to the income statement | 1,479,914 | 1,856,688 | 1,479,914 | 1,856,688 |
| Exchange rate variance on foreign currency provisions | 3,541 | 5,338 | 3,541 | 5,338 |
| Other movements | – | – | – | – |
| Closing balance | 11,582,514 | 10,099,059 | 11,582,514 | 10,099,059 |
| Total of individual and collective impairment | 15,787,168 | 13,501,227 | 15,787,168 | 13,501,227 |
26.3 Lease Receivable
26.3 (a) Gross Lease Receivable
| Within one year | 8,805,101 | 8,488,519 | 8,822,066 | 8,521,928 |
| From one to five years | 12,968,682 | 16,699,526 | 12,968,682 | 16,723,518 |
| Over five years | 4,962 | 203 | 4,962 | 203 |
| Total gross lease receivable (before the impairment provision) | 21,778,745 | 25,188,248 | 21,795,710 | 25,245,649 |
| GROUP | BANK | |||
| 2013 | 2012 | 2013 | 2012 | |
| Rs. ’000 | Rs. ’000 | Rs. ’000 | Rs. ’000 | |
26.3 (b) Lease Receivable within One Year |
||||
| Total lease receivable within one year | 11,668,279 | 11,803,820 | 11,685,244 | 11,837,229 |
| Less: Unearned lease income | 2,863,178 | 3,315,301 | 2,863,178 | 3,315,301 |
| Provision for individual impairment | 21,428 | 16,366 | 21,428 | 16,366 |
| Provision for collective impairment | 311,517 | 192,440 | 311,517 | 192,440 |
| Sub total | 8,472,156 | 8,279,713 | 8,489,121 | 8,313,122 |
26.3 (c) Lease Receivable from One to Five Years
| Total lease receivable from one to five years | 15,327,002 | 20,005,414 | 15,327,002 | 20,029,406 |
| Less: Unearned lease income | 2,358,320 | 3,305,888 | 2,358,320 | 3,305,888 |
| Provision for individual impairment | 32,876 | 33,735 | 32,876 | 33,735 |
| Provision for collective impairment | 477,954 | 396,667 | 477,954 | 396,667 |
| Sub total | 12,457,852 | 16,269,124 | 12,457,852 | 16,293,116 |
26.3 (d) Lease Receivable after Five Years
| Total lease receivable after five years | 5,667 | 209 | 5,667 | 209 |
| Less: Unearned lease income | 705 | 6 | 705 | 6 |
| Provision for individual impairment | 13 | – | 13 | – |
| Provision for collective impairment | 183 | 5 | 183 | 5 |
| Sub total | 4,766 | 198 | 4,766 | 198 |
| Total gross lease receivable | 21,778,745 | 25,188,248 | 21,795,710 | 25,245,649 |
| Total net lease receivable | 20,934,774 | 24,549,035 | 20,951,739 | 24,606,436 |
26.3 (e) Movement in Provision for Individual Impairment on Lease Receivable
| Opening balance | 50,100 | 34,337 | 50,100 | 34,337 |
| Charge/(write back) to the income statement | 124,732 | 74,471 | 124,732 | 74,471 |
| Net write-off/(recoveries) during the year | (121,122) | (58,114) | (121,122) | (58,114) |
| Exchange rate variance on foreign currency provisions | – | – | – | – |
| Interest accrued on impaired loans and advances | (2,891) | (1,270) | (2,891) | (1,270) |
| Other movements | 3,498 | 676 | 3,498 | 676 |
| Closing balance | 54,317 | 50,100 | 54,317 | 50,100 |
26.3 (f) Movement in the Provision for Collective Impairment on Lease Receivable
| Opening balance | 589,113 | 357,719 | 589,113 | 357,719 |
| Charge/(write back) to the income statement | 200,541 | 231,394 | 200,541 | 231,394 |
| Exchange rate variance on foreign currency provisions | – | – | – | – |
| Other movements | – | – | – | – |
| Closing balance | 789,654 | 589,113 | 789,654 | 589,113 |
| Total of individual and collective impairment on lease receivable | 843,971 | 639,213 | 843,971 | 639,213 |
| GROUP | BANK | |||
| 2013 | 2012 | 2013 | 2012 | |
| Rs. ’000 | Rs. ’000 | Rs. ’000 | Rs. ’000 | |
26.4 Summary of Gross Loans and Receivables to Other Customers |
||||
26.4 (a) Gross Loans and Receivables to Other Customers |
||||
| Bills of exchange | 5,043,658 | 5,685,865 | 5,043,658 | 5,685,865 |
| Loans and advances | 343,468,535 | 309,167,542 | 343,467,030 | 309,167,885 |
| Lease receivable | 21,778,745 | 25,188,248 | 21,795,710 | 25,245,649 |
| Securities purchased under resale agreements | 8,946,499 | 3,697,682 | 8,946,499 | 3,697,682 |
| Total gross loans and advances | 379,237,437 | 343,739,337 | 379,252,897 | 343,797,081 |
26.4 (b) Gross Other Receivables
| Government securities [Refer Note 26.5] | 51,116,932 | 39,283,936 | 51,116,932 | 39,283,936 |
| Investments [Refer Note 26.6] | 4,377,014 | 3,335,291 | 4,377,014 | 3,335,291 |
| Total gross other receivables | 55,493,946 | 42,619,227 | 55,493,946 | 42,619,227 |
| Total gross loans and receivables to other customers | 434,731,383 | 386,358,564 | 434,746,843 | 386,416,308 |
26.5 Government Securities
Government Securities - Sri Lanka
| Treasury bills | 39,751 | 17,000 | 39,751 | 17,000 |
| Treasury bonds | 605,859 | 605,859 | 605,859 | 605,859 |
| Sri Lanka development bonds | 42,502,838 | 33,694,269 | 42,502,838 | 33,694,269 |
| Sub total | 43,148,448 | 34,317,128 | 43,148,448 | 34,317,128 |
Investments in Government Securities - Bangladesh
| Treasury bills and bonds | 7,968,484 | 4,966,808 | 7,968,484 | 4,966,808 |
| Sub total | 7,968,484 | 4,966,808 | 7,968,484 | 4,966,808 |
| Total government securities | 51,116,932 | 39,283,936 | 51,116,932 | 39,283,936 |
26.6 Investments
| Debentures [Refer Note 26.6 (a)] | 3,273,401 | 447,296 | 3,273,401 | 447,296 |
| Lease backed securities [Refer Note 26.6 (b)] | – | 106,477 | – | 106,477 |
| Trust certificates [Refer Note 26.6 (c)] | 1,029,072 | 2,137,534 | 1,029,072 | 2,137,534 |
| Corporate debts [Refer Note 26.6 (d)] | – | 539,831 | – | 539,831 |
| Corporate bonds in Bangladesh [Refer Note 26.6 (e)] | 74,541 | 104,153 | 74,541 | 104,153 |
| Total investments | 4,377,014 | 3,335,291 | 4,377,014 | 3,335,291 |
| GROUP | BANK | |||||||
| As at December 31, 2013 | As at December 31, 2012 | As at December 31, 2013 | As at December 31, 2012 | |||||
| Cost | Market Value | Cost | Market Value | Cost | Market Value | Cost | Market Value | |
| Rs. ’000 | Rs. ’000 | Rs. ’000 | Rs. ’000 | Rs. ’000 | Rs. ’000 | Rs. ’000 | Rs. ’000 | |
26.6 (a) Debentures |
||||||||
| Quoted - Debentures | ||||||||
| Urban Development Authority (11% - 2015) | 447,296 | 447,296 | 447,296 | 428,427 | 447,296 | 447,296 | 447,296 | 428,427 |
| People’s Leasing & Finance PLC | 541,589 | 541,589 | – | – | 541,589 | 541,589 | – | – |
| Senkadagala Finance PLC | 41,869 | 41,869 | – | – | 41,869 | 41,869 | – | – |
| Singer (Sri Lanka) PLC | 181,005 | 181,005 | – | – | 181,005 | 181,005 | – | – |
| Central Finance PLC | 273,078 | 273,078 | – | – | 273,078 | 273,078 | – | – |
| Lion Brewery (Ceylon) PLC | 1,031,658 | 1,031,658 | – | – | 1,031,658 | 1,031,658 | – | – |
| Hayleys PLC | 91,575 | 91,575 | – | – | 91,575 | 91,575 | – | – |
| Singer Finance (Lanka) PLC | 355,756 | 355,756 | – | – | 355,756 | 355,756 | – | – |
| Nawaloka Hospitals PLC | 237,256 | 237,256 | – | – | 237,256 | 237,256 | – | – |
| Abans Ltd. | 72,319 | 72,319 | – | – | 72,319 | 72,319 | – | – |
| Sub total | 3,273,401 | 3,273,401 | 447,296 | 428,427 | 3,273,401 | 3,273,401 | 447,296 | 428,427 |
| The above debentures are stated at cost and classified under loans and receivables due to the inactive market. | ||||||||
26.6 (b) Lease Backed Securities |
||||||||
| People’s Leasing Company PLC | – | – | 106,477 | 106,477 | – | – | 106,477 | 106,477 |
| Sub total | – | – | 106,477 | 106,477 | – | – | 106,477 | 106,477 |
26.6 (c) Trust Certificates |
||||||||
| People’s Leasing Company PLC | 629,717 | 629,717 | 1,297,269 | 1,297,269 | 629,717 | 629,717 | 1,297,269 | 1,297,269 |
| LB Finance PLC | 297,415 | 297,415 | 573,835 | 573,835 | 297,415 | 297,415 | 573,835 | 573,835 |
| Softlogic Finance PLC | 101,940 | 101,940 | 184,879 | 184,879 | 101,940 | 101,940 | 184,879 | 184,879 |
| Central Finance PLC | – | – | 81,551 | 81,551 | – | – | 81,551 | 81,551 |
| Sub total | 1,029,072 | 1,029,072 | 2,137,534 | 2,137,534 | 1,029,072 | 1,029,072 | 2,137,534 | 2,137,534 |
26.6 (d) Corporate Debts |
||||||||
| Singer Sri Lanka PLC - 2012/13 | – | – | 539,831 | 539,831 | – | – | 539,831 | 539,831 |
| Sub total | – | – | 539,831 | 539,831 | – | – | 539,831 | 539,831 |
26.6 (e) Corporate Bonds in Bangladesh |
||||||||
| Corporate Bonds in Bangladesh | 74,541 | 74,541 | 104,153 | 104,153 | 74,541 | 74,541 | 104,153 | 104,153 |
| Sub total | 74,541 | 74,541 | 104,153 | 104,153 | 74,541 | 74,541 | 104,153 | 104,153 |
| BANK | ||||
| 2013 | 2012 | |||
| Individually Impaired Loans and Receivables | Individual Impairment | Individually Impaired Loans and Receivables | Individual Impairment | |
| Rs. ’000 | Rs. ’000 | Rs. ’000 | Rs. ’000 | |
26.7 Summary of Individually Impaired Loans and Receivables |
||||
| Loans and Advances | ||||
| Overdrafts | 1,011,562 | 755,677 | 999,942 | 594,264 |
| Trade finance | 495,877 | 355,102 | 1,958,765 | 1,142,987 |
| Lease receivable | 135,148 | 54,317 | 105,247 | 50,099 |
| Credit cards | – | – | – | – |
| Pawning | – | – | – | – |
| Staff loans | – | – | – | – |
| Housing loans | 23,456 | 4,182 | – | – |
| Personal loans | 2,148 | 1,476 | 1,927 | 1,927 |
| Term loans | 5,134,833 | 3,033,900 | 2,905,405 | 1,612,891 |
| Bills of exchange | – | – | – | – |
| Securities purchased under resale agreements | – | – | – | – |
| Total impaired loans and advances | 6,803,024 | 4,204,654 | 5,971,286 | 3,402,168 |
| Other receivables | ||||
| Government securities | – | – | – | – |
| Investments | – | – | – | – |
| Total Impaired other receivables | – | – | – | – |
| Total impaired loans and receivables | 6,803,024 | 4,204,654 | 5,971,286 | 3,402,168 |
27. Financial Investments - Available-for-Sale
| GROUP | BANK | |||
| 2013 | 2012 | 2013 | 2012 | |
| Rs. ’000 | Rs. ’000 | Rs. ’000 | Rs. ’000 | |
| Government securities [Refer Note 27.1] | 123,557,706 | 57,923,776 | 123,557,706 | 57,923,776 |
| Equity securities [Refer Note 27.2] | 190,584 | 39,416 | 190,584 | 39,416 |
| Quoted shares - (Mark to market value) | 145,492 | 3,737 | 145,492 | 3,737 |
| Unquoted shares - (at cost) | 45,092 | 35,679 | 45,092 | 35,679 |
| Total | 123,748,290 | 57,963,192 | 123,748,290 | 57,963,192 |
There were no impairment losses on financial investments - available-for-sale as at December 31, 2013 (2012 - Nil).
| GROUP | BANK | |||
| 2013 | 2012 | 2013 | 2012 | |
| Rs. ’000 | Rs. ’000 | Rs. ’000 | Rs. ’000 | |
27.1 Government Securities |
||||
| Treasury bills | 81,742,889 | 29,872,941 | 81,742,889 | 29,872,941 |
| Treasury bonds | 39,902,375 | 28,050,835 | 39,902,375 | 28,050,835 |
| Sri Lanka sovereign bonds | 1,912,442 | – | 1,912,442 | – |
| Total | 123,557,706 | 57,923,776 | 123,557,706 | 57,923,776 |
27.2 Equity Securities
| GROUP | BANK | |||||||
| As at December 31, 2013 | As at December 31, 2012 | As at December 31, 2013 | As at December 31, 2012 | |||||
| Cost | Market Value/Manager’s Buying Price | Cost | Market Value/Manager’s Buying Price | Cost | Market Value/Manager’s Buying Price | Cost | Market Value/Manager’s Buying Price | |
| Rs. ’000 | Rs. ’000 | Rs. ’000 | Rs. ’000 | Rs. ’000 | Rs. ’000 | Rs. ’000 | Rs. ’000 | |
| Quoted Shares: | ||||||||
| Hatton National Bank PLC | 315 | 1,729 | 315 | 1,740 | 315 | 1,729 | 315 | 1,740 |
| (11,760 Ordinary Shares) | (@ Rs. 147.00) | (@ Rs. 148.00) | (@ Rs. 147.00) | (@ Rs. 148.00) | ||||
| (11,760 Ordinary Shares as at December 31, 2012) | ||||||||
| Sampath Bank PLC | 72 | 638 | 72 | 723 | 72 | 638 | 72 | 723 |
| (3,714 Ordinary Shares) | (@ Rs. 171.90) | (@ Rs. 200.50) | (@ Rs. 171.90) | (@ Rs. 200.50) | ||||
| (3,606 Ordinary Shares as at December 31, 2012) | ||||||||
| Seylan Bank PLC | 24 | 65 | 24 | 56 | 24 | 65 | 24 | 56 |
| (1,015 Ordinary Shares) | (@ Rs. 64.20) | (@ Rs. 56.00) | (@ Rs. 64.20) | (@ Rs. 56.00) | ||||
| (1,000 Ordinary Shares as at December 31, 2012) | ||||||||
| DFCC Bank PLC | 155 | 451 | 155 | 395 | 155 | 451 | 155 | 395 |
| (3,496 Ordinary Shares) | (@ Rs. 129.00) | (@ Rs. 112.90) | (@ Rs. 129.00) | (@ Rs. 112.90) | ||||
| (3,496 Ordinary Shares as at December 31, 2012) | ||||||||
| Nations Trust Bank PLC | 22 | 83 | 22 | 75 | 22 | 83 | 22 | 75 |
| (1,333 Ordinary Shares) | (@ Rs. 62.20) | (@ Rs. 56.00) | (@ Rs. 62.20) | (@ Rs. 56.00) | ||||
| (1,333 Ordinary Shares as at December 31, 2012) | ||||||||
| NDB Bank PLC | 215 | 871 | 215 | 748 | 215 | 871 | 215 | 748 |
| (5,424 Ordinary Shares) | (@ Rs. 160.50) | (@ Rs. 137.90) | (@ Rs. 160.50) | (@ Rs. 137.90) | ||||
| (5,424 Ordinary Shares as at December 31, 2012) | ||||||||
| VISA Inc. | – | 141,655 | – | – | – | 141,655 | – | – |
| (4,856 Class C Common Stock) | (@ US$. 222.68) | (@ US$. 222.68) | ||||||
| (2012- Nil ) | ||||||||
| Sub total | 803 | 145,492 | 803 | 3,737 | 803 | 145,492 | 803 | 3,737 |
| Unquoted Shares: | ||||||||
| Credit Information Bureau of Sri Lanka | 440 | 440 | 440 | 440 | 440 | 440 | 440 | 440 |
| (4,400 Ordinary Shares) | (@ Rs. 100.00) | (@ Rs. 100.00) | (@ Rs. 100.00) | (@ Rs. 100.00) | ||||
| (4,400 Ordinary Shares as at December 31, 2012) | ||||||||
| Fitch Ratings Lanka Ltd. | 625 | 625 | 625 | 625 | 625 | 625 | 625 | 625 |
| (62,500 Ordinary Shares) | (@ Rs. 10.00) | (@ Rs. 10.00) | (@ Rs. 10.00) | (@ Rs. 10.00) | ||||
| (62,500 Ordinary Shares as at December 31, 2012) | ||||||||
| Lanka Clear (Pvt) Ltd. | 10,000 | 10,000 | 10,000 | 10,000 | 10,000 | 10,000 | 10,000 | 10,000 |
| (1,000,000 Ordinary Shares) | (@ Rs. 10.00) | (@ Rs. 10.00) | (@ Rs. 10.00) | (@ Rs. 10.00) | ||||
| (1,000,000 Ordinary Shares as at December 31, 2012) | ||||||||
| Lanka Financial Service Bureau Ltd. | 2,250 | 2,250 | 2,250 | 2,250 | 2,250 | 2,250 | 2,250 | 2,250 |
| (225,000 Ordinary Shares) | (@ Rs. 10.00) | (@ Rs. 10.00) | (@ Rs. 10.00) | (@ Rs. 10.00) | ||||
| (225,000 Ordinary Shares as at December 31, 2012) | ||||||||
| Society for Worldwide Interbank Financial Telecommunication (SWIFT) | 7,259 | 7,259 | 7,259 | 7,259 | 7,259 | 7,259 | 7,259 | 7,259 |
| (47 Ordinary Shares) | (@Rs. 154,446) | (@Rs. 154,446) | (@Rs. 154,446) | (@Rs. 154,446) | ||||
| (47 Ordinary Shares as at December 31, 2012) | ||||||||
| RAM Ratings (Lanka) Ltd. | 8,620 | 8,620 | – | – | 8,620 | 8,620 | – | – |
| (689,590 Ordinary Shares) | (@ Rs. 12.50) | – | – | (@ Rs. 12.50) | – | – | ||
| (2012 - Nil) | ||||||||
| Central Depository of Bangladesh Ltd. | ||||||||
| (3,427,083 Shares of Bangladesh Taka 2.75 each, converted @ Rs. 1.68825 per Taka) | 15,898 | 15,898 | 15,105 | 15,105 | 15,898 | 15,898 | 15,105 | 15,105 |
| (3,427,083 Shares of Bangladesh Taka 2.75 each, converted @ Rs. 1.60411 per Taka as at December 31, 2012) | ||||||||
| Sub total | 45,092 | 45,092 | 35,679 | 35,679 | 45,092 | 45,092 | 35,679 | 35,679 |
| Total | 45,895 | 190,584 | 36,482 | 39,416 | 45,895 | 190,584 | 36,482 | 39,416 |
28. Investments in Subsidiaries
| GROUP | BANK | ||||||||
| As at December 31, 2013 | As at December 31, 2012 | As at December 31, 2013 | As at December 31, 2012 | ||||||
| Holding | Cost | Market Value/Directors’ Valuation | Cost | Market Value/Directors’ Valuation | Cost | Market Value/Directors’ Valuation | Cost | Market Value/Directors’ Valuation | |
| % | Rs. ’000 | Rs. ’000 | Rs. ’000 | Rs. ’000 | Rs. ’000 | Rs. ’000 | Rs. ’000 | Rs. ’000 | |
| Local Subsidiaries: | |||||||||
| Quoted: | |||||||||
| Commercial Development Company PLC | 94.55 | – | – | – | – | 274,393 | 752,220 | 274,393 | 692,088 |
| (11,345,705 Ordinary Shares) | (@ Rs. 66.30) | (@ Rs. 61.00) | |||||||
| (11,345,705 Ordinary Shares as at December 31, 2012) | |||||||||
| Unquoted: | |||||||||
| ONEzero Company Ltd. | 100.00 | – | – | – | – | 5,000 | 5,000 | 5,000 | 5,000 |
| (500,001 Ordinary Shares) | (@ Rs. 10.00) | (@ Rs. 10.00) | |||||||
| (500,001 Ordinary Shares as at December 31, 2012) | |||||||||
| Foreign Subsidiary: | |||||||||
| Unquoted: | |||||||||
| Commex - Sri Lanka S.R.L. (Incorporated in Italy) * | 100.00 | – | – | – | – | 95,133 | 95,133 | 95,133 | 95,133 |
| Gross Total | – | – | – | – | 374,526 | 852,353 | 374,526 | 792,221 | |
| Less: Provision for impairment [Refer Note 28.1] | – | – | – | – | (85,580) | (85,580) | (71,396) | (71,396) | |
| Net Total | – | – | – | – | 288,946 | 766,773 | 303,130 | 720,825 | |
* The Bank is yet to commence intended commercial operations in Italy and as such made provisions for the expenses incurred on account of Italy operations before finalising the Bank‘s Financial Statements. All arrangements have been made to submit the new application to ‘Bank of Italy’ to obtain Money Transfer License during the first half of 2014 and it is expected to commence commercial operations during the second half of 2014.
28.1 Movement in Provision for Impairment during the Year
| GROUP | BANK | |||
| 2013 | 2012 | 2013 | 2012 | |
| Rs. ’000 | Rs. ’000 | Rs. ’000 | Rs. ’000 | |
| Opening balance | – | – | 71,396 | 38,454 |
| Charge/(write back) to the income statement | – | – | 14,184 | 32,942 |
| Closing balance | – | – | 85,580 | 71,396 |
29. Investments in Associates
| GROUP | BANK | ||||||||
| As at December 31, 2013 | As at December 31, 2012 | As at December 31, 2013 | As at December 31, 2012 | ||||||
| Holding | Cost | Market Value/Directors’ Valuation | Cost | Market Value/Directors’ Valuation | Cost | Market Value/Directors’ Valuation | Cost | Market Value/Directors’ Valuation | |
| % | Rs. ’000 | Rs. ’000 | Rs. ’000 | Rs. ’000 | Rs. ’000 | Rs. ’000 | Rs. ’000 | Rs. ’000 | |
| Local Associates: | |||||||||
| Unquoted: | |||||||||
| Equity Investments Lanka Ltd. | 22.92 | 44,331 | 60,411 | 44,331 | 62,711 | 44,331 | 60,411 | 44,331 | 62,711 |
| (4,110,938 Ordinary Shares) | |||||||||
| (4,110,938 Ordinary Shares as at December 31, 2012) | |||||||||
| Add: Share of profit applicable to the Bank: | |||||||||
| Balance at the beginning of the year | 18,380 | 47,580 | |||||||
| Current year’s share of profit/(loss) after tax | (221) | (21,198) | |||||||
| Less: Dividend received during the year | (2,079) | (8,002) | |||||||
| Current year’s retained profit | (2,300) | (29,200) | |||||||
| Balance at the end of the year | 16,080 | 18,380 | |||||||
| Total | 60,411 | 60,411 | 62,711 | 62,711 | 44,331 | 60,411 | 44,331 | 62,711 | |
| Commercial Insurance Brokers (Pvt) Ltd. | 18.91 | 100 | 33,762 | 100 | 31,001 | ||||
| (120,000 Ordinary Shares) | |||||||||
| (120,000 Ordinary Shares as at December 31, 2012) | |||||||||
| Add: Share of profit applicable to the Bank: | |||||||||
| Balance at the beginning of the year | 30,901 | 27,970 | |||||||
| Current year’s share of profit after tax | 3,374 | 3,544 | |||||||
| Less: Dividend received during the year | (613) | (613) | |||||||
| Current year’s retained profit | 2,761 | 2,931 | |||||||
| Balance at the end of the year | 33,662 | 30,901 | |||||||
| Total | 33,762 | 33,762 | 31,001 | 31,001 | |||||
| Total value of Investments in Unquoted associates at carrying value on equity basis | 94,173 | 93,712 | 44,331 | 44,331 | |||||
| Less: provision for impairment | – | – | – | – | |||||
| Net Total | 94,173 | 93,712 | 44,331 | 44,331 | |||||
| Total market value/Directors’ Valuation of Investments in Associates | 94,173 | 93,712 | 60,411 | 62,711 | |||||
The Group recognises the share of net assets of associates under equity method to arrive at the Director’s valuation.
30. Property, Plant & Equipment
30.1 Group - 2013
| Freehold Land | Freehold Buildings | Leasehold Buildings | Computer Equipment | Motor Vehicles | Office Equipment - Furniture & Fixtures | Capital Work-in-Progress | Total 31.12.2013 | Total 31.12.2012 | |
| Rs. ’000 | Rs. ’000 | Rs. ’000 | Rs. ’000 | Rs.’000 | Rs. ’000 | Rs. ’000 | Rs. ’000 | Rs. ’000 | |
| Cost/Valuation | |||||||||
| Opening balance | 3,502,740 | 2,209,630 | 838,626 | 3,170,031 | 367,490 | 3,542,095 | 119,003 | 13,749,615 | 12,719,314 |
| Additions during the year | 51,658 | 20,389 | – | 348,577 | 20,858 | 384,674 | 132,863 | 959,019 | 1,260,079 |
| Surplus on revaluation of property | – | – | – | – | – | – | – | – | 192,237 |
| Disposals during the year | – | – | – | (137,017) | (58,843) | (86,011) | – | (281,871) | (396,409) |
| Exchange rate variance | – | – | – | 6,580 | 2,357 | 13,874 | 1,399 | 24,210 | 58,524 |
| Transfers/adjustments | – | – | – | (59) | – | 235 | (2,102) | (1,926) | (84,130) |
| Closing balance | 3,554,398 | 2,230,019 | 838,626 | 3,388,112 | 331,862 | 3,854,867 | 251,163 | 14,449,047 | 13,749,615 |
| Accumulated Depreciation | |||||||||
| Opening balance | – | 67,722 | 146,515 | 2,351,033 | 236,328 | 2,001,136 | – | 4,802,734 | 4,216,103 |
| Charge for the year | – | 69,132 | 21,949 | 337,730 | 48,169 | 359,948 | – | 836,928 | 942,765 |
| Reversal of over provided depreciation | – | – | (119,345) | – | – | – | – | (119,345) | – |
| Disposals during the year | – | – | – | (136,262) | (50,221) | (75,072) | – | (261,555) | (336,079) |
| Exchange rate variance | – | – | – | 5,710 | 1,746 | 7,663 | – | 15,119 | 31,849 |
| Transfers/adjustments | – | – | – | (59) | – | – | – | (59) | (51,904) |
| Closing balance | – | 136,854 | 49,119 | 2,558,152 | 236,022 | 2,293,675 | – | 5,273,822 | 4,802,734 |
| Net book value as at 31.12.2013 | 3,554,398 | 2,093,165 | 789,507 | 829,960 | 95,840 | 1,561,192 | 251,163 | 9,175,225 | |
| Net book value as at 31.12.2012 | 3,502,740 | 2,141,908 | 692,111 | 818,998 | 131,162 | 1,540,959 | 119,003 | 8,946,881 |
30.2 Group - 2012
| Freehold Land | Freehold Buildings | Leasehold Buildings | Computer Equipment | Motor Vehicles | Office Equipment - Furniture & Fixtures | Capital Work-in-Progress | Total 31.12.2012 | Total 31.12.2011 | |
| Rs. ’000 | Rs. ’000 | Rs. ’000 | Rs. ’000 | Rs. ’000 | Rs. ’000 | Rs. ’000 | Rs. ’000 | Rs. ’000 | |
| Cost/Valuation | |||||||||
| Opening balance | 3,340,369 | 2,118,829 | 626,755 | 2,991,766 | 407,363 | 3,172,049 | 62,183 | 12,719,314 | 10,277,801 |
| Additions during the year | 169,371 | 83,801 | 3,547 | 362,217 | 85,743 | 468,513 | 86,887 | 1,260,079 | 1,391,393 |
| Transfer of accumulated depreciation on assets revalued | – | – | – | – | – | – | – | – | (161,279) |
| Surplus on revaluation of property | – | – | 192,237 | – | – | – | – | 192,237 | 1,669,182 |
| Disposals during the year | – | – | – | (199,527) | (131,485) | (65,397) | – | (396,409) | (34,387) |
| Exchange rate variance | – | – | – | 15,064 | 5,869 | 34,977 | 2,614 | 58,524 | (42,102) |
| Transfers/adjustments | (7,000) | 7,000 | 16,087 | 511 | – | (68,047) | (32,681) | (84,130) | (381,294) |
| Closing balance | 3,502,740 | 2,209,630 | 838,626 | 3,170,031 | 367,490 | 3,542,095 | 119,003 | 13,749,615 | 12,719,314 |
| Accumulated Depreciation | |||||||||
| Opening balance | – | – | 111,792 | 2,087,949 | 259,938 | 1,756,424 | – | 4,216,103 | 3,688,573 |
| Charge for the year | – | 67,722 | 34,723 | 448,211 | 59,589 | 332,520 | – | 942,765 | 734,115 |
| Transfer of accumulated depreciation on assets revalued | – | – | – | – | – | – | – | – | (161,279) |
| Disposals during the year | – | – | – | (197,489) | (86,744) | (51,846) | – | (336,079) | (22,654) |
| Exchange rate variance | – | – | – | 12,081 | 3,545 | 16,223 | – | 31,849 | (22,594) |
| Transfers/adjustments | – | – | – | 281 | – | (52,185) | – | (51,904) | (58) |
| Closing balance | – | 67,722 | 146,515 | 2,351,033 | 236,328 | 2,001,136 | – | 4,802,734 | 4,216,103 |
| Net book value as at 31.12.2012 | 3,502,740 | 2,141,908 | 692,111 | 818,998 | 131,162 | 1,540,959 | 119,003 | 8,946,881 | |
| Net book value as at 31.12.2011 | 3,340,369 | 2,118,829 | 514,963 | 903,817 | 147,425 | 1,415,625 | 62,183 | 8,503,211 |
The carrying amount of Group’s revalued assets that would have been included in the Financial Statements had the assets been carried at cost less depreciation is as follows:
| 2013 | 2012 | |||||
| Cost | Accumulated Depreciation | Net Book Value | Cost | Accumulated Depreciation | Net Book Value | |
| Rs. ’000 | Rs. ’000 | Rs. ’000 | Rs. ’000 | Rs. ’000 | Rs. ’000 | |
| Class of Asset | ||||||
| Freehold Land | 608,588 | – | 608,588 | 556,930 | – | 556,930 |
| Freehold buildings | 1,027,212 | 269,653 | 757,559 | 1,006,822 | 243,973 | 762,849 |
| Leasehold buildings | 259,759 | 136,567 | 123,192 | 255,908 | 128,348 | 127,560 |
| Total | 1,895,559 | 406,220 | 1,489,339 | 1,819,660 | 372,321 | 1,447,339 |
30.3 Bank - 2013
| Freehold Land | Freehold Buildings | Leasehold Buildings | Computer Equipment | Motor Vehicles | Office Equipment - Furniture & Fixtures | Capital Work-in-Progress | Total 31.12.2013 | Total 31.12.2012 | |
| Rs. ’000 | Rs. ’000 | Rs. ’000 | Rs. ’000 | Rs. ’000 | Rs. ’000 | Rs. ’000 | Rs. ’000 | Rs. ’000 | |
| Cost/Valuation | |||||||||
| Opening balance | 3,502,740 | 2,209,630 | 104,625 | 3,165,537 | 127,704 | 3,539,146 | 98,604 | 12,747,986 | 11,793,172 |
| Additions during the year | 51,658 | 20,389 | – | 348,142 | 20,858 | 384,294 | 132,863 | 958,204 | 1,197,639 |
| Disposals during the year | – | – | – | (137,017) | (4,435) | (86,011) | – | (227,463) | (266,664) |
| Exchange rate variance | – | – | – | 6,580 | 2,357 | 13,789 | – | 22,726 | 55,788 |
| Transfers/adjustments | – | – | – | (59) | – | 235 | (2,102) | (1,926) | (31,949) |
| Closing balance | 3,554,398 | 2,230,019 | 104,625 | 3,383,183 | 146,484 | 3,851,453 | 229,365 | 13,499,527 | 12,747,986 |
| Accumulated Depreciation | |||||||||
| Opening balance | – | 67,722 | 27,170 | 2,348,915 | 83,297 | 1,999,764 | – | 4,526,868 | 3,886,142 |
| Charge for the year | – | 69,132 | 3,599 | 337,145 | 16,479 | 359,669 | – | 786,024 | 859,675 |
| Disposals during the year | – | – | – | (136,262) | (4,435) | (75,072) | – | (215,769) | (251,075) |
| Exchange rate variance | – | – | – | 5,710 | 1,746 | 7,663 | – | 15,119 | 31,849 |
| Transfers/adjustments | – | – | – | (59) | – | – | – | (59) | 277 |
| Closing balance | – | 136,854 | 30,769 | 2,555,449 | 97,087 | 2,292,024 | – | 5,112,183 | 4,526,868 |
| Net book value as at 31.12.2013 | 3,554,398 | 2,093,165 | 73,856 | 827,734 | 49,397 | 1,559,429 | 229,365 | 8,387,344 | |
| Net book value as at 31.12.2012 | 3,502,740 | 2,141,908 | 77,455 | 816,622 | 44,407 | 1,539,382 | 98,604 | 8,221,118 |
30.4 Bank - 2012
| Freehold Land | Freehold Buildings | Leasehold Buildings | Computer Equipment | Motor Vehicles | Office Equipment - Furniture & Fixtures | Capital Work-in-Progress | Total 31.12.2012 | Total 31.12.2011 | |
| Rs. ’000 | Rs. ’000 | Rs. ’000 | Rs. ’000 | Rs. ’000 | Rs. ’000 | Rs. ’000 | Rs. ’000 | Rs. ’000 | |
| Cost/Valuation | |||||||||
| Opening balance | 3,340,369 | 2,118,829 | 104,625 | 2,987,702 | 95,111 | 3,102,138 | 44,398 | 11,793,172 | 9,351,129 |
| Additions during the year | 169,371 | 83,801 | – | 361,787 | 28,464 | 467,329 | 86,887 | 1,197,639 | 1,379,607 |
| Accumulated depreciation | – | – | – | – | – | – | – | – | (161,279) |
| Surplus on revaluation of property | – | – | – | – | – | – | – | – | 1,654,329 |
| Disposals during the year | – | – | – | (199,527) | (1,740) | (65,397) | – | (266,664) | (7,682) |
| Exchange rate variance | – | – | – | 15,064 | 5,869 | 34,855 | – | 55,788 | (42,075) |
| Transfers/adjustments | (7,000) | 7,000 | – | 511 | – | 221 | (32,681) | (31,949) | (380,857) |
| Closing balance | 3,502,740 | 2,209,630 | 104,625 | 3,165,537 | 127,704 | 3,539,146 | 98,604 | 12,747,986 | 11,793,172 |
| Accumulated Depreciation | |||||||||
| Opening balance | – | – | 23,571 | 2,086,344 | 68,923 | 1,707,304 | – | 3,886,142 | 3,421,568 |
| Charge for the year | – | 67,722 | 3,599 | 447,698 | 12,569 | 328,087 | – | 859,675 | 648,543 |
| Transfer of accumulated depreciation on assets revalued | – | – | – | – | – | – | – | – | (161,279) |
| Disposals during the year | – | – | – | (197,489) | (1,740) | (51,846) | – | (251,075) | (38) |
| Exchange rate variance | – | – | – | 12,081 | 3,545 | 16,223 | – | 31,849 | (22,594) |
| Transfers/adjustments | – | – | – | 281 | – | (4) | – | 277 | (58) |
| Closing balance | – | 67,722 | 27,170 | 2,348,915 | 83,297 | 1,999,764 | – | 4,526,868 | 3,886,142 |
| Net book value as at 31.12.2012 | 3,502,740 | 2,141,908 | 77,455 | 816,622 | 44,407 | 1,539,382 | 98,604 | 8,221,118 | |
| Net book value as at 31.12.2011 | 3,340,369 | 2,118,829 | 81,054 | 901,358 | 26,188 | 1,394,834 | 44,398 | 7,907,030 |
The carrying amount of Bank’s revalued assets that would have been included in the Financial Statements had the assets been carried at cost less depreciation is as follows:
| 2013 | 2012 | |||||
| Cost | Accumulated Depreciation | Net Book Value | Cost | Accumulated Depreciation | Net Book Value | |
| Rs. ’000 | Rs. ’000 | Rs. ’000 | Rs. ’000 | Rs. ’000 | Rs. ’000 | |
| Class of Asset | ||||||
| Freehold Land | 608,588 | – | 608,588 | 556,930 | – | 556,930 |
| Freehold buildings | 1,027,212 | 269,653 | 757,559 | 1,006,822 | 243,973 | 762,849 |
| Leasehold buildings | 102,726 | 38,437 | 64,289 | 102,726 | 35,869 | 66,857 |
| Total | 1,738,526 | 308,090 | 1,430,436 | 1,666,478 | 279,842 | 1,386,636 |
30.5 (a) Information on Freehold Land and Buildings of the Bank - Extents and Locations
[As required by Rule No. 7.6 (viii) of the ‘Continuing Listing Requirements’ of the Colombo Stock Exchange]
| Location | Extent (Perches) | Buildings (Square Feet) | Revalued Amounts Land Rs. ’000 | Revalued Amounts Buildings Rs. ’000 | Net Book Value Rs. ’000 | As a % of Total NBV |
| CEO’s Bungalow - No. 27, Queens Road, Colombo 3 | 64 | 5,616 | 416,650 | 8,350 | 422,637 | 7.48 |
| Holiday Bungalow - Bandarawela | 423 | 5,546 | 51,400 | 11,400 | 61,890 | 1.10 |
| Ambatenne Estate, Bandarawela | ||||||
| Holiday Bungalow - Haputale | 207 | 4,533 | 25,700 | 15,300 | 39,475 | 0.70 |
| No. 23, Lily Avenue, Welimada Road, Haputale | ||||||
| Branch Buildings | ||||||
| Battaramulla - No. 213, Kaduwela Road, Battaramulla | 14 | 11,216 | 24,517 | 61,483 | 81,910 | 1.45 |
| Borella - No. 92, D.S. Senanayake Mawatha, Borella, Colombo 8 | 16 | 12,566 | 70,335 | 62,202 | 128,399 | 2.27 |
| Chilaw - No. 44, Colombo Road, Chilaw | 35 | 10,000 | 61,750 | 70,104 | 128,312 | 2.27 |
| Galewela - No. 49/57, Matale Road, Galewela | 99 | 6,380 | 19,800 | 13,200 | 32,341 | 0.57 |
| Galle City - No. 130, Main Street, Galle | 7 | 3,675 | 33,750 | 7,250 | 40,518 | 0.72 |
| Galle Fort - No. 22, Church Street, Fort, Galle | 100 | 11,625 | 100,000 | 50,000 | 147,504 | 2.61 |
| Gampaha - No. 51, Queen Mary’s Road, Gampaha | 33 | 9,000 | 51,658 | 10,101 | 61,715 | 1.10 |
| Hikkaduwa - No. 217, Galle Road, Hikkaduwa | 37 | 6,713 | 16,740 | 21,260 | 36,939 | 0.65 |
| Ja-Ela - No. 140, Negombo Road, Ja–Ela | 13 | 7,755 | 23,187 | 16,813 | 39,161 | 0.69 |
| Jaffna - No. 474, Hospital Road, Jaffna | 77 | 5,146 | 272,135 | 12,865 | 283,971 | 5.03 |
| Kandy - No. 120, Kotugodella Veediya, Kandy | 45 | 44,500 | 342,000 | 231,000 | 557,632 | 9.87 |
| Kegalle - No. 186, Main Street, Kegalle | 85 | 2,650 | 115,000 | 7,000 | 121,533 | 2.15 |
| Keyzer Street - No. 32, Keyzer Street, Colombo 11 | 7 | 5,608 | 45,000 | 25,000 | 68,752 | 1.22 |
| Kollupitiya - No. 285, Galle Road, Colombo 3 | 17 | 16,254 | 100,000 | 63,000 | 159,855 | 2.83 |
| Kotahena - No. 198, George R. De Silva Mawatha, Kotahena, Colombo 13 | 28 | 33,017 | 110,000 | 219,768 | 318,781 | 5.64 |
| Kurunegala - No. 4, Suratissa Mawatha, Kurunegala | 15 | 8,916 | 140,000 | 85,000 | 220,757 | 3.91 |
| Maharagama - No. 154, High Level Road, Maharagama | 18 | 8,000 | 62,125 | 43,200 | 102,451 | 1.81 |
| Matale - No. 70, King Street, Matale | 51 | 9,950 | 60,000 | 62,000 | 118,905 | 2.11 |
| Matara - No. 18, Station Road, Matara | 37 | 8,137 | 28,155 | 24,145 | 51,080 | 0.90 |
| Minuwangoda - No. 42, Siriwardena Mawatha, Minuwangoda | 25 | 4,950 | 37,500 | 36,958 | 72,591 | 1.29 |
| Mutwal - No. 160, St. James Street, Colombo 15 | 17 | Bare Land | 22,300 | – | 22,300 | 0.39 |
| Narahenpita - No. 201, Kirula Road, Narahenpita, Colombo 5 | 22 | 11,193 | 99,225 | 70,775 | 165,291 | 2.93 |
| Narammala - No. 55, Negombo Road, Narammala | 43 | 5,760 | 44,550 | 15,450 | 59,229 | 1.05 |
| Negombo - No. 24, 26, Fernando Avenue, Negombo | 37 | 14,439 | 49,500 | 27,004 | 74,806 | 1.32 |
| Nugegoda - No. 100, Stanley Thilakaratne Mawatha, Nugegoda | 39 | 11,138 | 195,000 | 44,552 | 235,997 | 4.18 |
| Nuwara Eliya - No. 36, Buddha Jayanthi Mawatha, Nuwara Eliya | 42 | 10,184 | 72,000 | 69,000 | 137,555 | 2.44 |
| Panadura - No. 375, Galle Road, Panadura | 12 | 6,168 | 18,450 | 19,735 | 36,215 | 0.64 |
| Pettah - People’s Park Shopping Complex, Colombo 11 | – | 3,183 | – | 50,000 | 47,148 | 0.83 |
| Pettah - Stores - People’s Park Shopping Complex, Colombo 11 | – | 218 | – | 4,000 | 3,681 | 0.07 |
| Pettah - Main Street - No. 280, Main Street, Pettah, Colombo 11 | 30 | 22,760 | 169,371 | 73,704 | 240,512 | 4.27 |
| Trincomalee - No. 474, Power House Road, Trincomalee | 100 | Bare Land | 75,000 | – | 75,000 | 1.33 |
| Union Place - No. 1, Union Place, Colombo 2 | 30 | 63,385 | 360,000 | 640,000 | 957,422 | 16.95 |
| Wellawatte - No. 343, Galle Road, Colombo 6 | 45 | 15,050 | 204,100 | 35,900 | 236,421 | 4.19 |
| Wennappuwa - No. 262, 264, Colombo Road, Wennappuwa | 36 | 8,852 | 37,500 | 22,500 | 58,877 | 1.04 |
| Total | 3,554,398 | 2,230,019 | 5,647,563 | 100.00 |
30.5 (b) Information on Freehold Land and Buildings of the Bank - Valuations
[As required by Rule No. 7.6 (viii) of the ‘Continuing Listing Requirements’ of the Colombo Stock Exchange.]
Date of Valuation December 31, 2011
| Net Book Value before Revaluation | Revalued Amount of | Revaluation Gain/(Loss) Recognised on | |||||||
| Location | Address | Name of Professional Valuer | Method of Valuation | Land | Buildings | Land | Buildings | Land | Buildings |
| Rs. ‘000 | Rs. ‘000 | Rs. ‘000 | Rs. ‘000 | Rs. ‘000 | Rs. ‘000 | ||||
| CEO’s Bungalow | No. 27, Queens Road, Colombo 3 | Siri Nissanka | Depreciated Replacement Cost Method | 352,550 | 4,967 | 416,650 | 8,350 | 64,100 | 3,383 |
| Holiday Bungalow - Bandarawela | Ambatenne Estate, Bandarawela | Sarath G. Fernando | Comparative Method | 8,468 | 2,347 | 51,400 | 11,400 | 42,932 | 9,053 |
| Holiday Bungalow - Haputale | No. 23, Lily Avenue, Welimada Road, Haputale | Sarath G. Fernando | Comparative Method | 5,189 | 945 | 25,700 | 15,300 | 20,512 | 14,355 |
| Battaramulla | No. 213, Kaduwela Road, Battaramula | Siri Nissanka | Income Method/Depreciated Replacement Cost Method | 11,208 | 31,453 | 24,517 | 61,483 | 13,309 | 30,030 |
| Borella | No. 92, D.S. Senanayake Mawatha, Colombo 8 | Ranjan J. Samarakone | Contractor’s Method | 23,000 | 30,000 | 70,335 | 62,202 | 47,335 | 32,202 |
| Chilaw | No. 44, Colombo Road, Chilaw | P.B. Kalugalagedara | Direct Capital Comparison Method | 25,850 | 65,673 | 61,750 | 67,000 | 35,900 | 1,327 |
| Galewela | No. 49/57, Matale Road, Galewela | W.S. Pemaratne | Contractor’s Method/Comparison Method | 10,455 | 1,936 | 19,800 | 13,200 | 9,346 | 11,264 |
| Galle City | No. 130, Main Street, Galle | S.A.S. Fernando | Comparison Method | 5,064 | 4,445 | 33,750 | 7,250 | 28,687 | 2,805 |
| Galle Fort | No. 22, Church Street, Fort, Galle | S.A.S. Fernando | Comparison Method | 90,000 | 17,500 | 100,000 | 50,000 | 10,000 | 32,500 |
| Hikkaduwa | No. 217, Galle Road, Hikkaduwa | S.A.S. Fernando | Comparison Method | 1,303 | 4,293 | 16,740 | 21,260 | 15,439 | 16,965 |
| Ja–Ela | No. 140, Negombo Road, Ja–Ela | W.D.P. Rupananda | Contractor’s Test Method | 11,021 | 15,382 | 23,187 | 16,812 | 12,163 | 1,430 |
| Jaffna | No. 474, Hospital Road, Jaffna | S.T. Sanmuganathan | Depreciated Replacement Cost Method/Investment Method | 137,135 | 6,432 | 272,135 | 12,865 | 135,000 | 6,433 |
| Kandy | No. 120, Kotugodella Veediya, Kandy | Sarath G. Fernando | Comparative Method/Income Method | 333,832 | 181,078 | 342,000 | 231,000 | 8,168 | 49,922 |
| Kegalle | No. 186, Main Street, Kegalle | Sarath G. Fernando | Comparative Method/Income Method | 100,000 | – | 122,000 | – | 22,000 | – |
| Keyzer Street | No. 32, Keyzer Street, Colombo 11 | P.B. Kalugalagedara | Investment Method | 14,940 | 6,401 | 45,000 | 25,000 | 30,060 | 18,599 |
| Kollupitiya | No. 285, Galle Road, Colombo 3 | P.B. Kalugalagedara | Investment Method | 82,000 | 56,842 | 100,000 | 63,000 | 18,000 | 6,158 |
| Kotahena | No. 198, George R. De Silva Mawatha, Kotahena, Colombo 13 | P.B. Kalugalagedara | Investment Method | 85,000 | 374,928 | 110,000 | 208,984 | 25,000 | (165,944) |
| Kurunegala | No. 4, Suratissa Mawatha, Kurunegala | W.S. Pemaratne | Investment Method | 39,481 | 10,542 | 140,000 | 85,000 | 100,519 | 74,458 |
| Maharagama | No. 154, Highlevel Road, Maharagama | Ranjan J. Samarakone | Contractor’s Method | 5,238 | 13,518 | 62,125 | 43,200 | 56,887 | 29,682 |
| Matale | No. 70, King Street, Matale | Sarath G. Fernando | Comparative Method/Income Method | 8,000 | 36,203 | 60,000 | 62,000 | 52,000 | 25,797 |
| Matara | No. 18, Station Road, Matara | S.A.S. Fernando | Comparison Method | 16,893 | 7,116 | 28,155 | 23,595 | 11,264 | 16,479 |
| Minuwangoda | No. 42, Siriwardena Mawatha, Minuwangoda | P.B. Kalugalagedara | Direct Capital Comparison Method | 8,575 | 4,348 | 37,500 | 32,500 | 28,925 | 28,152 |
| Mutwal | No. 160, St. James Street, Colombo 15 | P.B. Kalugalagedara | Direct Capital Comparison Method | 20,592 | – | 22,300 | – | 1,708 | – |
| Narahenpita | No. 201, Kirula Road, Narahenpita, Colombo 5 | Siri Nissanka | Income Method/Depreciated Replacement Cost Method | 88,200 | 59,593 | 99,225 | 70,775 | 11,025 | 11,182 |
| Narammala | No. 55, Negombo Road, Narammala | W.S. Pemaratne | Investment Method | 11,510 | 4,360 | 44,550 | 15,450 | 33,040 | 11,090 |
| Negombo | No. 24, 26, Fernando Avenue, Negombo | W.D.P. Rupananda | Contractor’s Test Method | 16,000 | 16,929 | 49,500 | 25,516 | 33,500 | 8,587 |
| Nugegoda | No. 100, Stanley Thilakaratne Mawatha, Nugegoda | Ranjan J. Samarakone | Contractor’s Method | 39,000 | 15,876 | 195,000 | 44,552 | 156,000 | 28,676 |
| Nuwara Eliya | No. 36/3, Buddha Jayanthi Mawatha, Nuwara Eliya | Sarath G. Fernando | Comparative Method/Income Method | 61,800 | 61,492 | 72,000 | 69,000 | 10,200 | 7,508 |
| Panadura | No. 375, Galle Road, Panadura | Ranjan J. Samarakone | Contractor’s Method | 8,930 | 11,592 | 18,450 | 19,735 | 9,520 | 8,143 |
| Pettah | People‘s Park Shopping Complex, Colombo 11 | W.D.P. Rupananda | Investment Method | – | 11,288 | – | 54,000 | – | 42,712 |
| Trincomalee | No. 474, Power House Road, Trincomalee | S.A.S. Fernando | Comparison Method | 27,500 | – | 75,000 | – | 47,500 | – |
| Union Place | No. 1, Union Place, Colombo 2 | Siri Nissanka | Income Method/Depreciated Replacement Cost Method | 300,000 | 554,464 | 360,000 | 640,000 | 60,000 | 85,536 |
| Wellawatte | No. 343, Galle Road, Colombo 6 | K.C.B. Condegama | Investment Method | 187,375 | 33,444 | 204,100 | 35,900 | 16,725 | 2,456 |
| Wennappuwa | No. 262, 264, Colombo Road, Wennappuwa | W.D.P. Rupananda | Contractor’s Test Method | 8,665 | 14,710 | 37,500 | 22,500 | 28,835 | 7,790 |
| Total | 2,144,774 | 1,660,097 | 3,340,369 | 2,118,829 | 1,195,599 | 458,730 | |||
30.6 Title Restriction on Property, Plant & Equipment
There were no restrictions existed on the title of the property, plant & equipment of the Group as at the date of the Statement of Financial Position.
30.7 Property, Plant & Equipment Pledged as Security for Liabilities
There were no items of property, plant & equipment pledged as securities for liabilities.
30.8 Compensation from Third Parties for Items of Property, Plant & Equipment
There were no compensation received/receivable from third parties for items of property, plant & equipment that were impaired, lost or given up.
30.9 Fully Depreciated Property, Plant & Equipment
The cost of fully-depreciated property, plant & equipment of the Bank which are still in use as at the date of the Statement of Financial Position is as follows:
| 31.12.2013 | 31.12.2012 | |
| Rs. ’000 | Rs. ’000 | |
| Computer equipment | 1,794,881 | 1,463,312 |
| Office equipment, furniture & fixtures | 1,127,494 | 986,218 |
| Motor vehicles | 38,486 | 36,494 |
30.10 Temporarily Idle Property, Plant & Equipment
Following property, plant & equipment of the Bank were temporarily idle (until the assets issue to business unit) as at the date of the Statement of Financial Position:
| 31.12.2013 | 31.12.2012 | |
| Rs. ’000 | Rs. ’000 | |
| Computer equipment | 70,862 | 46,637 |
| Office equipment, furniture & fixtures | 80,490 | 66,594 |
30.11 Property, Plant & Equipment Retired from Active Use
Following property, plant & equipment of the Bank were retired from active use as at the date of the Statement of Financial Position.
| 31.12.2013 | 31.12.2012 | |
| Rs. ’000 | Rs. ’000 | |
| Computer equipment | 32,726 | 67,773 |
| Office equipment, furniture & fixtures | 16,300 | 9,309 |
| Motor vehicles | 214 | – |
30.12 Borrowing Costs
There were no capitalised borrowing costs related to the acquisition of property, plant & equipment during the year 2013 (2012 - Nil).
31. Intangible Assets
31.1 Computer Software
| GROUP | BANK | |||
| 2013 | 2012 | 2013 | 2012 | |
| Rs. ’000 | Rs. ’000 | Rs. ’000 | Rs. ’000 | |
| Cost/Valuation | ||||
| At the beginning of the year | 1,262,607 | 1,121,243 | 1,262,281 | 1,120,917 |
| Additions during the year | 216,162 | 139,161 | 215,708 | 139,161 |
| Disposals during the year | – | – | – | – |
| Exchange rate variance | 1,182 | 2,944 | 1,182 | 2,944 |
| Transfers/adjustments | – | (741) | – | (741) |
| At the end of the year | 1,479,951 | 1,262,607 | 1,479,171 | 1,262,281 |
| Accumulated Amortisation | ||||
| At the beginning of the year | 906,586 | 731,326 | 906,427 | 731,216 |
| Amortisation for the year | 149,347 | 174,104 | 149,291 | 174,055 |
| Disposals during the year | – | – | – | – |
| Exchange rate variance | 785 | 1,298 | 785 | 1,298 |
| Transfers/adjustments | – | (142) | – | (142) |
| At the end of the year | 1,056,718 | 906,586 | 1,056,503 | 906,427 |
| Net book value | 423,233 | 356,021 | 422,668 | 355,854 |
31.2 Software Under Development
| GROUP | BANK | |||
| 2013 | 2012 | 2013 | 2012 | |
| Rs. ’000 | Rs. ’000 | Rs. ’000 | Rs. ’000 | |
| Cost/Valuation | ||||
| At the beginning of the year | 150,140 | 85,121 | 141,184 | 77,313 |
| Additions during the year | 77,850 | 116,486 | 77,850 | 116,486 |
| Transfers/adjustments during the year | (174,109) | (52,615) | (174,109) | (52,615) |
| Exchange rate variance | 614 | 1,148 | – | – |
| Disposals during the year | – | – | – | – |
| At the end of the year | 54,495 | 150,140 | 44,925 | 141,184 |
| Total intangible assets [Refer Notes 31.1 and 31.2] | 477,728 | 506,161 | 467,593 | 497,038 |
There were no restrictions existed on the title of the intangible assets of the group as at the date of the Statement of Financial Position. Further, there were no items pledged as securities for liabilities. There were no capitalised borrowing costs related to the acquisition of intangible assets during the year 2013 (2012 - Nil).
32. Leasehold Property
| GROUP | BANK | |||
| 2013 | 2012 | 2013 | 2012 | |
| Rs. ’000 | Rs. ’000 | Rs. ’000 | Rs. ’000 | |
| Cost/Valuation | ||||
| At the beginning of the year | 128,700 | 128,700 | 84,840 | 84,840 |
| Additions during the year | – | – | – | – |
| At the end of the year | 128,700 | 128,700 | 84,840 | 84,840 |
| Accumulated Amortisation | ||||
| At the beginning of the year | 16,924 | 15,472 | 7,536 | 6,594 |
| Amortisation for the year | 1,452 | 1,452 | 942 | 942 |
| At the end of the year | 18,376 | 16,924 | 8,478 | 7,536 |
| Net book value | 110,324 | 111,776 | 76,362 | 77,304 |
33. Deferred Tax Assets and Liabilities
33.1 Summary of Net Deferred Tax Liability
| GROUP | BANK | |||||||
| 2013 | 2012 | 2013 | 2012 | |||||
| Temporary Difference |
Tax Effect | Temporary Difference |
Tax Effect | Temporary Difference |
Tax Effect | Temporary Difference |
Tax Effect | |
| Rs. ’000 | Rs. ’000 | Rs. ’000 | Rs. ’000 | Rs. ’000 | Rs. ’000 | Rs. ’000 | Rs. ’000 | |
| At the beginning of the year | 5,191,693 | 1,431,725 | 4,724,597 | 1,276,116 | 4,541,132 | 1,249,567 | 4,300,809 | 1,234,469 |
| Amount originating/(reversing) to income statement | 755,857 | 206,506 | 707,638 | 147,871 | 747,134 | 204,063 | 673,102 | 141,125 |
| Amount originating/(reversing) to Statement of Comprehensive Income | (27,425) | (7,679) | – | – | (28,704) | (8,037) | – | – |
| Tax effect on revaluation surplus on property | – | – | 192,237 | 133,765 | – | – | – | – |
| Tax effect on pre-acquisition reserves | 54,947 | 15,385 | – | – | – | – | – | – |
| Unwinding of the deferred tax effect on revaluation surplus on Freehold Buildings | 432,779 | 121,178 | (432,779) | (121,178) | 432,779 | 121,178 | (432,779) | (121,178) |
| Exchange rate variance | – | (3,701) | – | (4,849) | – | (3,701) | – | (4,849) |
| At the end of the year | 6,407,851 | 1,763,414 | 5,191,693 | 1,431,725 | 5,692,341 | 1,563,070 | 4,541,132 | 1,249,567 |
33.2 Reconciliation of Net Deferred Tax Liability
| GROUP | ||||||
| Statement of Financial Position |
Income Statement | Statement of Comprehensive Income |
||||
| 2013 | 2012 | 2013 | 2012 | 2013 | 2012 | |
| Rs. ’000 | Rs. ’000 | Rs. ’000 | Rs. ’000 | Rs. ’000 | Rs. ’000 | |
| Deferred Tax Liabilities on: | ||||||
| Accelerated depreciation for tax purposes - Own assets | 397,135 | 342,038 | (55,097) | (412) | – | – |
| Accelerated depreciation for tax purposes - Leased assets | 1,274,209 | 1,049,259 | (224,950) | (237,157) | – | – |
| Revaluation surplus on freehold buildings | 589,937 | 619,855 | 29,918 | – | – | – |
| Tax effect on actuarial gains on Defined Benefit Plans | 2,062 | – | – | – | (2,062) | – |
| Tax effect on pre-acquisition reserves | 15,385 | – | – | – | – | – |
| Unwinding of the deferred tax effect on revaluation surplus on freehold buildings | – | (121,178) | – | – | – | – |
| Effect of exchange rate variance | 9 | 9 | (3,701) | (4,849) | – | – |
| 2,278,737 | 1,889,983 | (253,830) | (242,418) | (2,062) | – | |
| Deferred Tax Assets on: | ||||||
| Finance leases | 2,004 | 5,090 | (3,086) | 2,882 | – | – |
| Defined Benefit Plans | 245,563 | 203,903 | 41,660 | 69,753 | – | – |
| Tax effect on actuarial losses on Defined Benefit Plans | 9,741 | – | – | – | 9,741 | – |
| General provision on credit card advances | – | 18,567 | (18,567) | 3,861 | – | – |
| Specific provision on lease receivable | 56,254 | 119,536 | (63,282) | – | – | – |
| Leave encashment | 153,608 | 111,162 | 42,446 | 18,051 | – | – |
| Straight lining of lease rentals | 8,739 | – | 8,739 | – | – | – |
| De-recognition of commission income | 39,414 | – | 39,414 | – | – | – |
| 515,323 | 458,258 | 47,324 | 94,547 | 9,741 | – | |
| Deferred tax effect on comprehensive income | (206,506) | (147,871) | 7,679 | – | ||
| Net deferred tax liability | 1,763,414 | 1,431,725 | ||||
33.3 Reconciliation of Net Deferred Tax Liability
| Bank | ||||||
| Statement of Financial Position |
Income Statement | Statement of Comprehensive Income |
||||
| 2013 | 2012 | 2013 | 2012 | 2013 | 2012 | |
| Rs. ’000 | Rs. ’000 | Rs. ’000 | Rs. ’000 | Rs. ’000 | Rs. ’000 | |
| Deferred Tax Liabilities on: | ||||||
| Accelerated depreciation for tax purposes - Own assets | 366,494 | 312,132 | (54,362) | 11,998 | – | – |
| Accelerated depreciation for tax purposes - Leased assets | 1,274,208 | 1,049,259 | (224,949) | (237,157) | – | – |
| Revaluation surplus on freehold buildings | 427,927 | 457,845 | 29,918 | – | – | – |
| Tax effect on actuarial gains on Defined Benefit Plans | 1,510 | – | – | – | (1,510) | – |
| Unwinding of the deferred tax effect on revaluation surplus on freehold buildings | – | (121,178) | – | – | – | – |
| Effect of exchange rate variance | 9 | 9 | (3,701) | (4,849) | – | – |
| 2,070,148 | 1,698,067 | (253,094) | (230,008) | (1,510) | – | |
| Deferred Tax Assets on: | ||||||
| Finance leases | – | – | – | – | – | – |
| Defined Benefit Plans | 239,516 | 199,234 | 40,282 | 66,970 | – | – |
| Tax effect on actuarial losses on Defined Benefit Plans | 9,547 | – | – | – | 9,547 | – |
| General provision on credit card advances | – | 18,568 | (18,568) | 3,862 | – | – |
| Specific provision on lease receivable | 56,254 | 119,536 | (63,282) | – | – | – |
| Leave encashment | 153,608 | 111,162 | 42,446 | 18,051 | – | – |
| Straight-lining of lease rentals | 8,739 | – | 8,739 | – | – | – |
| De-recognition of commission income | 39,414 | – | 39,414 | – | – | – |
| 507,078 | 448,500 | 49,031 | 88,883 | 9,547 | – | |
| Deferred tax effect on comprehensive income | (204,063) | (141,125) | 8,037 | – | ||
| Net deferred tax liability | 1,563,070 | 1,249,567 | ||||
| GROUP | BANK | |||
| 2013 | 2012 | 2013 | 2012 | |
| Rs. ’000 | Rs. ’000 | Rs. ’000 | Rs. ’000 | |
34. Other Assets |
||||
| Income receivable | 22,335 | 34,999 | 22,335 | 34,999 |
| Deposits and prepayments | 1,518,412 | 1,365,559 | 1,521,526 | 1,358,727 |
| Clearing account balance | 2,999,575 | 4,126,806 | 2,999,575 | 4,126,806 |
| Unamortised cost on staff loans | 2,757,193 | 2,106,871 | 2,757,103 | 2,106,768 |
| Other accounts | 2,239,168 | 1,544,909 | 2,238,626 | 1,560,906 |
| Total | 9,536,683 | 9,179,144 | 9,539,165 | 9,188,206 |
35. Due to Banks
| Borrowings | 7,915,406 | 4,763,565 | 7,915,406 | 4,763,565 |
| Local currency borrowings | – | 65,018 | – | 65,018 |
| Foreign currency borrowings | 7,915,406 | 4,698,547 | 7,915,406 | 4,698,547 |
| Securities sold under repurchase (repo) agreements | 6,278,813 | 130,380 | 6,278,813 | 130,380 |
| Total | 14,194,219 | 4,893,945 | 14,194,219 | 4,893,945 |
| GROUP | BANK | |||
| 2013 | 2012 | 2013 | 2012 | |
| Rs. ’000 | Rs. ’000 | Rs. ’000 | Rs. ’000 | |
36. Derivative Financial Instruments |
||||
| Interest rate derivatives | ||||
| Interest rate swaps | – | – | – | – |
| Foreign currency derivatives | ||||
| Forward foreign exchange contracts | 1,411,916 | 84,291 | 1,411,916 | 84,291 |
| Total | 1,411,916 | 84,291 | 1,411,916 | 84,291 |
37. Due to Other Customers
| Local currency deposits | 342,766,249 | 291,139,626 | 342,820,225 | 291,168,788 |
| Foreign currency deposits | 108,332,697 | 99,429,056 | 108,332,698 | 99,442,760 |
| Total | 451,098,946 | 390,568,682 | 451,152,923 | 390,611,548 |
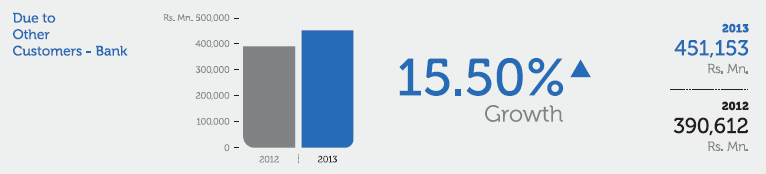
| GROUP | BANK | |||
| 2013 | 2012 | 2013 | 2012 | |
| Rs. ’000 | Rs. ’000 | Rs. ’000 | Rs. ’000 | |
37.1 Analysis of Due to Customers |
||||
| (a) By product | ||||
| Current account deposits | 36,887,413 | 32,076,534 | 36,887,453 | 32,076,534 |
| Savings deposits | 159,395,267 | 141,810,844 | 159,421,958 | 141,840,006 |
| Time deposits | 251,250,263 | 208,095,610 | 251,277,509 | 208,109,314 |
| Certificates of deposit | 3,566,003 | 8,585,694 | 3,566,003 | 8,585,694 |
| Sub total | 451,098,946 | 390,568,682 | 451,152,923 | 390,611,548 |
| (b) By currency | ||||
| Sri Lanka Rupee | 342,766,249 | 291,139,626 | 342,820,225 | 291,168,788 |
| United States Dollar | 59,873,350 | 52,783,593 | 59,873,351 | 52,797,297 |
| Bangladesh Taka | 6,556,111 | 24,964,651 | 6,556,111 | 24,964,651 |
| Great Britain Pound | 7,437,142 | 6,476,478 | 7,437,142 | 6,476,478 |
| Australian Dollar | 5,474,369 | 8,322,024 | 5,474,369 | 8,322,024 |
| Euro | 27,698,162 | 5,591,752 | 27,698,162 | 5,591,752 |
| Other currencies | 1,293,563 | 1,290,558 | 1,293,563 | 1,290,558 |
| Sub total | 451,098,946 | 390,568,682 | 451,152,923 | 390,611,548 |
| (c) By institution/customers | ||||
| Deposits from banks | 1,704,408 | 2,957,256 | 1,704,408 | 2,957,256 |
| Deposits from finance companies | 3,736,661 | 3,004,452 | 3,736,661 | 3,004,452 |
| Deposits from other customers | 445,657,877 | 384,606,974 | 445,711,854 | 384,649,840 |
| Sub total | 451,098,946 | 390,568,682 | 451,152,923 | 390,611,548 |
The maturity analysis of Deposits is given in Note 50.
| GROUP | BANK | |||
| 2013 | 2012 | 2013 | 2012 | |
| Rs. ’000 | Rs. ’000 | Rs. ’000 | Rs. ’000 | |
| 38. Other Borrowings | ||||
| Refinance borrowings | 6,427,536 | 7,633,595 | 6,427,536 | 7,633,595 |
| Securities sold under repurchase (repo) agreements | 39,054,967 | 31,481,970 | 39,230,639 | 31,629,224 |
| Borrowings from International Finance Corporation (IFC) | 8,515,000 | 8,320,000 | 8,515,000 | 8,320,000 |
| Total | 53,997,503 | 47,435,565 | 54,173,175 | 47,582,819 |
39. Other Provisions
| Provision for contingencies | 2,409 | 2,409 | 2,409 | 2,409 |
| Total | 2,409 | 2,409 | 2,409 | 2,409 |
| GROUP | BANK | |||
| 2013 | 2012 | 2013 | 2012 | |
| Rs. ’000 | Rs. ’000 | Rs. ’000 | Rs. ’000 | |
40. Other Liabilities |
||||
| Accrued expenditure | 1,672,283 | 1,856,614 | 1,666,095 | 1,850,635 |
| Cheques sent on clearing | 2,974,099 | 4,150,799 | 2,974,099 | 4,150,799 |
| Provision for gratuity payable [Refer Note 40.1] | 624,642 | 494,507 | 604,324 | 478,506 |
| Provision for unfunded pension scheme [Refer Note 40.2] | 191,541 | 167,394 | 191,541 | 167,394 |
| Payable on oil hedging transactions | 812,719 | 794,108 | 812,719 | 794,108 |
| Other payables | 3,610,532 | 2,953,791 | 3,578,431 | 2,921,366 |
| Total | 9,885,816 | 10,417,213 | 9,827,209 | 10,362,808 |
40.1 Provision for Gratuity Payable
| At the beginning of the year | 494,507 | 317,115 | 478,506 | 303,774 |
| Expense recognised in the income statement [Refer Note 40.1 (a)] | 147,378 | 179,083 | 141,700 | 174,680 |
| Exchange difference | 7,294 | 9,509 | 7,294 | 9,509 |
| Paid during the year | (19,528) | (11,200) | (17,784) | (9,457) |
| Expense recognised in other comprehensive income | (5,009) | – | (5,392) | – |
| At the end of the year | 624,642 | 494,507 | 604,324 | 478,506 |
40.1 (a) Expense Recognised in the Income Statement - Gratuity
| Interest cost | 56,118 | 26,090 | 54,470 | 25,062 |
| Current service cost | 91,260 | 152,993 | 87,230 | 149,618 |
| Total | 147,378 | 179,083 | 141,700 | 174,680 |
40.2 Provision for Unfunded Pension Scheme
| At the beginning of the year | 167,394 | 141,072 | 167,394 | 141,072 |
| Expense recognised in the income statement [Refer Note 40.2 (a)] | 18,413 | 49,710 | 18,413 | 49,710 |
| Paid during the year | (28,363) | (23,388) | (28,363) | (23,388) |
| Expense recognised in other comprehensive income | 34,097 | – | 34,097 | – |
| At the end of the year | 191,541 | 167,394 | 191,541 | 167,394 |
40.2 (a) Expense Recognised in the Income Statement - Unfunded Pension Scheme
| Interest cost | 18,413 | 14,107 | 18,413 | 14,107 | |
| Current service cost | – | – | – | – | |
| Actuarial loss | – | 35,603 | – | 35,603 | |
| Total | 18,413 | 49,710 | 18,413 | 49,710 |
40.3 Actuarial Gains/(Losses)
From 2013, actuarial gains/(losses) resulting from remeasurement of defined benefit liabilities/(assets) are recognised in the other comprehensive income. The comparatives have not been adjusted based on materiality.
| GROUP | BANK | |||
| 2013 | 2012 | 2013 | 2012 | |
| Rs. ’000 | Rs. ’000 | Rs. ’000 | Rs. ’000 | |
41. Due to Subsidiaries |
||||
| Local Subsidiaries | ||||
| Commercial Development Company PLC | – | – | 8,934 | 7,823 |
| ONEzero Company Ltd. | – | – | 6,752 | 14,441 |
| Sub Total | – | – | 15,686 | 22,264 |
| Foreign Subsidiaries | ||||
| Commex Sri Lanka S.R.L. - Italy | – | – | – | – |
| Sub Total | – | – | – | – |
| Total | – | – | 15,686 | 22,264 |
42. Subordinated Liabilities
| At beginning of the year | 973,210 | 973,210 | 973,210 | 973,210 |
| Redemptions during the year | (550) | – | (550) | – |
| Sub total [Refer Note 42.1] | 972,660 | 973,210 | 972,660 | 973,210 |
| Amount borrowed during the year [Refer Note 42.3] | 9,825,000 | – | 9,825,000 | – |
| Balance before adjusting for amortised interest | 10,797,660 | 973,210 | 10,797,660 | 973,210 |
| Net effect on amortised interest payable | 259,187 | 132,806 | 259,187 | 132,806 |
| At the end of the year | 11,056,847 | 1,106,016 | 11,056,847 | 1,106,016 |
Outstanding debentures as at December 31, 2013, consisted of 972,660 (2012 - 973,210) Unsecured Subordinated Redeemable debentures of Rs. 1,000/- each issued by the Bank in 2006, details of which are given below:
42.1 Debenture Categories
| BANK | ||||||||
| Debenture Categories | Colombo Stock Exchange Listing |
Interest Payable Frequency |
Allotment Date |
Maturity Date |
Effective Annual Yield | Value as at | ||
| 2013 | 2012 | 31.12.2013 | 31.12.2012 | |||||
| % | % | Rs. ’000 | Rs. ’000 | |||||
| Fixed Rate Debentures | ||||||||
| 2006/2016 - 13.25% p.a. | Not listed | Annually | 16.05.2006 | 16.05.2016 | 13.25 | 13.25 | 505,000 | 505,000 |
| 2006/2016 - 14.00% p.a. | Listed | Annually | 18.12.2006 | 18.12.2016 | 14.00 | 14.00 | 467,260 | 467,260 |
| Debenture Redeemed in 2013 | ||||||||
| 2006/2013 - 13.75% p.a. | Listed | Annually | 18.12.2006 | 18.12.2013 | 13.75 | 13.75 | – | 250 |
| 972,260 | 972,510 | |||||||
| Floating Rate Debentures | ||||||||
| 2006/2016 - 12 months TB rate (Gross) + 1% p.a. | Listed | Annually | 18.12.2006 | 18.12.2016 | 13.99 | 9.15 | 400 | 400 |
| Debenture Redeemed in 2013 | ||||||||
| 2006/2013 - 12 months TB rate (Gross) + 1% p.a. | Listed | Annually | 18.12.2006 | 18.12.2013 | 13.99 | 9.15 | – | 300 |
| 400 | 700 | |||||||
| Sub total | 972,660 | 973,210 | ||||||
The 12 Months TB Rate (Gross) - Twelve months Treasury Bill rate above is before deducting 10% Withholding Tax as published by the Central Bank of Sri Lanka immediately prior to the commencement of each interest period.
42.2 Debentures by Maturity
| GROUP | BANK | |||
| 2013 | 2012 | 2013 | 2012 | |
| Rs. ’000 | Rs. ’000 | Rs. ’000 | Rs. ’000 | |
| Due within 1 year | – | 550 | – | 550 |
| Due after 1 year | 972,660 | 972,660 | 972,660 | 972,660 |
| Total | 972,660 | 973,210 | 972,660 | 973,210 |
42.3 Other Subordinated Liabilities
| BANK | |||||||
| Interest Payable Frequency | Allotment Date | Maturity Date | Effective Annual Yield | Value as at | |||
| 2013 | 2012 | 31.12.2013 | 31.12.2012 | ||||
| % | % | Rs. ’000 | Rs. ’000 | ||||
| Borrowings from International Finance Corporation (IFC) | Bi-annually | 13.03.2013 | 14.03.2023 | 5.75 + LIBOR | – | 9,825,000 | – |
| Sub total | 9,825,000 | – | |||||
The above liabilities would in the event of the winding-up of the issuer, be subordinated to the claims of depositors and all other creditors of the issuer. The Bank has not had any defaults of principal, interest or other breaches with respect to its subordinated liabilities during the year ended December 31, 2013.
43. Stated Capital
| GROUP | BANK | |||
| 2013 | 2012 | 2013 | 2012 | |
| Rs. ’000 | Rs. ’000 | Rs. ’000 | Rs. ’000 | |
| Opening balance | 18,008,796 | 16,473,861 | 18,008,796 | 16,473,861 |
| Issue of Ordinary Voting Shares under Employee Share Option Plan | 76,074 | 62,942 | 76,074 | 62,942 |
| Issue of Ordinary Shares as part of the final dividend satisfied in the form of issue and allotment of new shares | 1,501,943 | 1,471,993 | 1,501,943 | 1,471,993 |
| Closing Balance | 19,586,813 | 18,008,796 | 19,586,813 | 18,008,796 |
43.1 Movement in Number of Ordinary Shares
| No. of Ordinary Voting Shares | No. of Ordinary Non-Voting Shares | |||
| 2013 | 2012 | 2013 | 2012 | |
| Opening balance | 780,014,232 | 765,085,320 | 53,473,748 | 52,364,846 |
| Issue of Ordinary Voting Shares under Employee Share Option Plan | 1,445,398 | 1,341,768 | – | – |
| Issue of Ordinary Shares as part of the final dividend satisfied in the form of issue and allotment of new shares | 13,076,189 | 13,587,144 | 1,069,474 | 1,108,902 |
| Closing Balance | 794,535,819 | 780,014,232 | 54,543,222 | 53,473,748 |
The shares of Commercial Bank of Ceylon PLC are quoted in the Colombo Stock Exchange. The Non-Voting Ordinary Shares of the Bank, rank pari passu in respect of all rights with the Ordinary Voting Shares of the Bank except voting rights on resolutions passed at general meetings.
The Bank has issued employee share options. The holders of ordinary shares are entitled to receive dividends declared from time to time and are entitled to one vote per share at meetings of the Bank.
43.2 Employee Share Option Plan - 2008
The Bank obtained the approval of the shareholders at an Extraordinary General Meeting held on April 16, 2008, to introduce an Employee Share Option Plan for the benefit of all the Executive Officers in Grade III and above by creating up to 3% of the ordinary voting shares at the rate of 1% shares each year over a period of three to five years, upon the Bank achieving specified performance targets.
1/3 of the options offered under each tranche is vested to eligible employees after one year from the date of offer, second 1/3 of the options after two years from the date of offer and final 1/3 after three years from the date of offer as detailed below:
Option price is determined on the basis of the weighted average market price of Bank’s voting shares, during the period of ten market days immediately prior to each option offer date.
Number of options offered under each tranche is based on the overall performance of the Bank and the individual performance of the eligible employees in the preceding year. In the event of a rights issue of shares, capitalisation of reserves, stock splits or stock dividends by the Bank during the vesting period, the number of options offered and the price are suitably adjusted as per the applicable rules of ESOP - 2008 which have been drafted in line with the accepted market practices.
| Tranche I | Total | |||
| Date granted | April 30, 2008 | April 30, 2008 | April 30, 2008 | |
| Price (Rs.) - (**) | 46.91 | 46.91 | 46.91 | |
| 1/3 of Options | 1/3 of Options | 1/3 of Options | ||
| Exercisable between | April 30, 2009 to April 29, 2013 |
April 30, 2010 to April 29, 2014 |
April 30, 2011 to April 29, 2015 |
|
| Original number of options | 777,308 | 777,308 | 777,308 | 2,331,924 |
| Additions consequent to Splits and Rights issues | 692,095 | 789,320 | 1,045,640 | 2,527,055 |
| Number of options cancelled before vesting | (52,943) | (52,943) | (52,943) | (158,829) |
| Options vested | 1,416,460 | 1,513,685 | 1,770,005 | 4,700,150 |
| Options cancelled due to non-acceptance | – | – | – | – |
| Number of options exercised up to December 31, 2013 | (1,416,460) | (1,310,853) | (1,408,442) | (4,135,755) |
| Number of options outstanding as at December 31, 2013 | – | 202,832 | 361,563 | 564,395 |
(**) Adjusted on account of the dividends declared in the form of issue and allotment of new shares, rights issue of shares and sub-division of shares.
| Tranche II | Total | |||
| Date granted | April 30, 2011 | April 30, 2011 | April 30, 2011 | |
| Price (Rs.) | 132.33 | 132.33 | 132.33 | |
| 1/3 of Options | 1/3 of Options | 1/3 of Options | ||
| Exercisable between | April 30, 2012 to April 29, 2016 | April 30, 2013 to April 29, 2017 | April 30, 2014 to April 29, 2018 | |
| Original number of options | 1,213,384 | 1,213,384 | 1,213,384 | 3,640,152 |
| Additions consequent to share split made in September 2011 | 1,213,384 | 1,213,384 | 1,213,384 | 3,640,152 |
| Options vested/to be vested as at December 31, 2013 | 2,426,768 | 2,426,768 | 2,426,768 | 7,280,304 |
| Tranche III | Total | |||
| Date granted | April 30, 2012 | April 30, 2012 | April 30, 2012 | |
| Price (Rs.) | 104.63 | 104.63 | 104.63 | |
| 1/3 of Options | 1/3 of Options | 1/3 of Options | ||
| Exercisable between | April 30, 2013 to April 29, 2017 | April 30, 2014 to April 29, 2018 | April 30, 2015 to April 29, 2019 | |
| Original number of options | 2,596,622 | 2,596,622 | 2,596,600 | 7,789,844 |
| Number of options cancelled before vesting | – | (43,222) | (43,224) | (86,446) |
| Options vested | 2,596,622 | 2,553,400 | 2,553,376 | 7,703,398 |
| Number of options exercised up to December 31, 2013 | (143,282) | – | – | (143,282) |
| Options vested/to be vested as at December 31, 2013 | 2,453,340 | 2,553,400 | 2,553,376 | 7,560,116 |
44. Statutory Reserves
44.1 Statutory Reserve Fund
| GROUP | BANK | |||
| 2013 | 2012 | 2013 | 2012 | |
| Rs. ’000 | Rs. ’000 | Rs. ’000 | Rs. ’000 | |
| Opening balance | 3,245,818 | 2,740,901 | 3,245,818 | 2,740,901 |
| Transfers during the year | 522,276 | 504,917 | 522,276 | 504,917 |
| Closing Balance | 3,768,094 | 3,245,818 | 3,768,094 | 3,245,818 |
The statutory reserve fund is maintained as per the requirements under Section 20 (1) of the Banking Act No. 30 of 1988. Accordingly, the fund is built up by allocating a sum equivalent to not less than 5% of the profit after tax, but before declaring any dividend or any profits that are transferred to elsewhere until the reserve is equal to 50% of the Bank’s stated capital and thereafter a further sum equivalent to 2% of such profit until the amount of said reserve fund is equal to the stated capital of the Bank.
The balance in the Statutory Reserve Fund will be used only for the purposes specified in the Section 20 (2) of the Banking Act No. 30 of 1988.
44.2 Primary Dealer Special Risk Reserve
| GROUP | BANK | |||
| 2013 | 2012 | 2013 | 2012 | |
| Rs. ’000 | Rs. ’000 | Rs. ’000 | Rs. ’000 | |
| Opening balance | 187,577 | 149,404 | 187,577 | 149,404 |
| Transfers during the year | 78,943 | 38,173 | 78,943 | 38,173 |
| Closing balance | 266,520 | 187,577 | 266,520 | 187,577 |
| Total Statutory Reserves | 4,034,614 | 3,433,395 | 4,034,614 | 3,433,395 |
As per the Direction issued by the Public Debt Department of Central Bank of Sri Lanka on April 18, 2005, with effect from July 1, 2005. Primary Dealers who maintain a capital above Rs. 300 Mn. are required to allocate 25% of post tax profits of the Primary Dealer Unit to a special risk reserve annually.
45. Retained Earnings
| GROUP | BANK | |||
| 2013 | 2012 | 2013 | 2012 | |
| Rs. ’000 | Rs. ’000 | Rs. ’000 | Rs. ’000 | |
| Opening balance | 4,172,814 | 2,588,194 | 4,178,080 | 2,547,336 |
| Total comprehensive income | 10,541,957 | 10,050,862 | 10,424,843 | 10,098,329 |
| Profit for the year | 10,563,378 | 10,079,829 | 10,445,511 | 10,098,329 |
| Other comprehensive income | (21,421) | (28,967) | (20,668) | – |
| Transfer to other reserves | (4,924,807) | (4,355,215) | (4,924,807) | (4,355,215) |
| Dividends | (5,444,752) | (4,112,370) | (5,444,752) | (4,112,370) |
| Deferred tax effect on pre-acquisition reserves | (14,547) | – | – | – |
| Re-classification of retained earnings to available-for-sale reserve | 28,967 | – | – | – |
| Write-back of dividend payable | – | 1,343 | – | – |
| Closing Balance | 4,359,632 | 4,172,814 | 4,233,364 | 4,178,080 |
46. Other Reserves
| GROUP | BANK | |||||
| Opening Balance | Movement/ Transfers | Closing Balance | Opening Balance | Movement/ Transfers | Closing Balance | |
| Rs. ’000 | Rs. ’000 | Rs. ’000 | Rs. ’000 | Rs. ’000 | Rs. ’000 | |
| 46 (a) Current Year - 2013 | ||||||
| Revaluation reserve [Refer Note 46.1] | 4,737,125 | (121,178) | 4,615,947 | 4,343,232 | (121,178) | 4,222,054 |
| General reserve [Refer Note 46.2] | 20,048,989 | 2,331,830 | 22,380,819 | 20,048,989 | 2,331,830 | 22,380,819 |
| Available-for-sale reserve [Refer Note 46.3] | 475,467 | 1,548,001 | 2,023,468 | 475,467 | 1,579,100 | 2,054,567 |
| Foreign currency translation reserve [Refer Note 46.4] | (755,101) | 361,343 | (393,758) | (757,894) | 350,969 | (406,925) |
| Investment fund reserve [Refer Note 46.5] | 2,846,935 | 1,991,758 | 4,838,693 | 2,846,935 | 1,991,758 | 4,838,693 |
| Total | 27,353,415 | 6,111,754 | 33,465,169 | 26,956,729 | 6,132,479 | 33,089,208 |
46 (b) Previous Year - 2012
| Revaluation reserve [Refer Note 46.1] | 4,550,836 | 186,289 | 4,737,125 | 4,222,054 | 121,178 | 4,343,232 |
| General reserve [Refer Note 46.2] | 17,889,471 | 2,159,518 | 20,048,989 | 17,889,471 | 2,159,518 | 20,048,989 |
| Available-for-sale reserve [Refer Note 46.3] | (143,969) | 619,436 | 475,467 | (143,969) | 619,436 | 475,467 |
| Foreign currency translation reserve [Refer Note 46.4] | (1,303,646) | 548,545 | (755,101) | (1,308,721) | 550,827 | (757,894) |
| Investment fund reserve [Refer Note 46.5] | 1,194,328 | 1,652,607 | 2,846,935 | 1,194,328 | 1,652,607 | 2,846,935 |
| Total | 22,187,020 | 5,166,395 | 27,353,415 | 21,853,163 | 5,103,566 | 26,956,729 |
46.1 Revaluation Reserve
| GROUP | BANK | |||
| 2013 | 2012 | 2013 | 2012 | |
| Rs. ’000 | Rs. ’000 | Rs. ’000 | Rs. ’000 | |
| Opening balance | 4,737,125 | 4,550,836 | 4,343,232 | 4,222,054 |
| Surplus on revaluation of freehold land and buildings | – | 181,760 | – | – |
| Deferred tax effect on revaluation surplus on freehold buildings | (121,178) | 4,529 | (121,178) | 121,178 |
| Closing balance | 4,615,947 | 4,737,125 | 4,222,054 | 4,343,232 |
The revaluation reserve relates to revaluation of freehold land & buildings and represents the fair value changes of the land & buildings as at the date of revaluation.
The Bank carried out a revaluation of all its freehold lands & buildings and recognised Rs. 1,654 Mn. as revaluation surplus as at December 31, 2011. (The Bank recognised Rs. 1,739 Mn. as Revaluation Surplus on a revaluation carried out on selected freehold lands & buildings as at December 31, 2010.)
46.2 General Reserve
| GROUP | BANK | |||
| 2013 | 2012 | 2013 | 2012 | |
| Rs. ’000 | Rs. ’000 | Rs. ’000 | Rs. ’000 | |
| Opening balance | 20,048,989 | 17,889,471 | 20,048,989 | 17,889,471 |
| Transfers during the year | 2,331,830 | 2,159,518 | 2,331,830 | 2,159,518 |
| Closing balance | 22,380,819 | 20,048,989 | 22,380,819 | 20,048,989 |
The general reserve is the result of the Bank transferring a certain amount of profit from retained earnings account to general reserve account. The purpose of setting up the general reserve is to meet potential future unknown liabilities.
46.3 Available-for-sale Reserve
| Opening balance | 475,467 | (143,969) | 475,467 | (143,969) |
| Net gains/(losses) on remeasuring available-for-sale financial investments | 1,576,968 | 619,436 | 1,579,100 | 619,436 |
| Re-classification of retained earnings to available-for-sale reserve | (28,967) | – | – | – |
| Closing balance | 2,023,468 | 475,467 | 2,054,567 | 475,467 |
The available-for-sale reserve comprises the cumulative net change in fair value of available-for-sale financial investments, until the assets are derecognised or impaired.
46.4 Foreign Currency Translation Reserve
| GROUP | BANK | |||
| 2013 | 2012 | 2013 | 2012 | |
| Rs. ’000 | Rs. ’000 | Rs. ’000 | Rs. ’000 | |
| Opening balance | (755,101) | (1,303,646) | (757,894) | (1,308,721) |
| Transfer of translation gains/(losses) | – | – | – | – |
| Net unrealised gains/(losses) from the translation of Financial Statements of the Foreign operation | 361,343 | 548,545 | 350,969 | 550,827 |
| Closing balance | (393,758) | (755,101) | (406,925) | (757,894) |
The foreign currency translation reserve comprises of all foreign currency differences arising from the translation of the Financial Statements of foreign operations.
As at the reporting date, the assets and liabilities of the Bank’s Bangladesh Operation and Commex - Sri Lanka S.R.L Italy, a subsidiary of the Bank were translated in to the presentation currency (Sri Lankan Rupee) at the exchange rate ruling at the date of the Statement of Financial Position and the Income Statement is translated at the average exchange rate for the period. The exchange differences arising on the translation are taken directly to Foreign Currency Translation Reserve which is classified as part of Equity.
46.5 Investment Fund Reserve
| GROUP | BANK | |||
| 2013 | 2012 | 2013 | 2012 | |
| Rs. ’000 | Rs. ’000 | Rs. ’000 | Rs. ’000 | |
| Opening balance | 2,846,935 | 1,194,328 | 2,846,935 | 1,194,328 |
| Transfers during the year | 1,991,758 | 1,652,607 | 1,991,758 | 1,652,607 |
| Closing balance | 4,838,693 | 2,846,935 | 4,838,693 | 2,846,935 |
Banks are required to transfer 8% of the profits calculated for the payment of Value Added Tax (VAT) on financial services and 5% of the profits before tax calculated for the payment of income tax to a fund identified as "Investment Fund Account" (IFA) as per a proposal made in the Government Budget 2011. The guidelines have also been issued by the Central Bank of Sri Lanka on utilisation of funds in this account.
The Bank provided funds for several projects utilising funds available in Investment Fund Account (IFA). The details of loans granted under IFA are as follows:
| Sector | Granted Amount Rs. ’000 | Rate of Interest (%) | Tenure of Loan |
| Infrastructure development | 2,767,945 | 9 - 13.57 | 14 - 14 1/2 Years |
| Factory/mills modernisation/establishment/expansion | 485,588 | 11.54 - 12.54 | 5 - 5 1/2 Years |
| Construction of hotels and for related purposes | 78,100 | 11.54 - 12.79 | 7 Years |
| Agriculture/livestock and fisheries | 65,340 | 11.04 | 5 1/2 Years |
| Total | 3,396,973 |
47. Non-Controlling Interest
| GROUP | BANK | |||
| 2013 | 2012 | 2013 | 2012 | |
| Rs. ’000 | Rs. ’000 | Rs. ’000 | Rs. ’000 | |
| Commercial Development Company PLC | 38,778 | 32,141 | – | – |
| Total | 38,778 | 32,141 | – | – |
48. Contingent Liabilities and Commitments
In the normal course of business, the Bank makes various irrevocable commitments and incurs certain contingent liabilities with legal recourse to its customers. Even though these obligations may not be recognised on the Statement of Financial Position, they do contain credit risk and are therefore form part of the overall risk profile of the Bank.
48.1 Contingencies
| GROUP | BANK | |||
| As at December 31, | 2013 | 2012 | 2013 | 2012 |
| Rs. ’000 | Rs. ’000 | Rs. ’000 | Rs. ’000 | |
| Contingent Liabilities: | ||||
| Guarantees | 26,393,171 | 23,997,143 | 26,393,171 | 23,997,143 |
| Performance bonds | 8,975,403 | 7,698,090 | 8,975,403 | 7,698,090 |
| Documentary credits | 20,795,460 | 19,566,782 | 20,795,460 | 19,566,782 |
| Other contingent liabilities [Refer Note 48.1(a)] | 166,957,995 | 166,060,094 | 166,957,995 | 166,060,094 |
| Total contingent liabilities | 223,122,029 | 217,322,109 | 223,122,029 | 217,322,109 |
48.1 (a) Other Contingent Liabilities
| GROUP | BANK | |||
| 2013 | 2012 | 2013 | 2012 | |
| Rs. ’000 | Rs. ’000 | Rs. ’000 | Rs. ’000 | |
| Other contingent liabilities: | ||||
| Acceptances | 17,682,089 | 16,255,563 | 17,682,089 | 16,255,563 |
| Bills for collection | 14,012,211 | 12,251,283 | 14,012,211 | 12,251,283 |
| Stock travellers’ cheques | 258,944 | 766,799 | 258,944 | 766,799 |
| Sub total | 31,953,244 | 29,273,645 | 31,953,244 | 29,273,645 |
| Forward exchange contracts: | ||||
| Forward exchange sales | 59,482,518 | 68,318,546 | 59,482,518 | 68,318,546 |
| Forward exchange purchases | 75,522,233 | 68,467,903 | 75,522,233 | 68,467,903 |
| Sub total | 135,004,751 | 136,786,449 | 135,004,751 | 136,786,449 |
| Total other contingent liabilities | 166,957,995 | 166,060,094 | 166,957,995 | 166,060,094 |
48.2 Commitments
48.2.1 Direct and Indirect Advances:
| Undrawn Commitments - Direct Advances | 54,249,566 | 51,021,034 | 54,249,566 | 51,021,034 |
| Undrawn Commitments - Indirect Advances | 16,990,485 | 10,853,593 | 16,990,485 | 10,853,593 |
| Total | 71,240,051 | 61,874,627 | 71,240,051 | 61,874,627 |
48.2.2 Capital Commitments
The Group has commitments for acquisition of Property, Plant & Equipment and intangible assets incidental to the ordinary course of business, as follows:
| GROUP | BANK | |||
| 2013 | 2012 | 2013 | 2012 | |
| Rs. ’000 | Rs. ’000 | Rs. ’000 | Rs. ’000 | |
48.2.2 (a) Capital Expenditure Commitments in relation to Property, Plant & Equipment |
||||
| Approved and contracted for | 496,260 | 43,986 | 496,260 | 43,986 |
| Approved but not contracted for | 525,132 | 312,779 | 525,132 | 312,779 |
| Total | 1,021,392 | 356,765 | 1,021,392 | 356,765 |
48.2.2 (b) Capital Expenditure Commitments in relation to Intangible Assets
| Approved and contracted for | 68,483 | 39,611 | 68,483 | 39,611 |
| Approved but not contracted for | – | – | – | – |
| Total | 68,483 | 39,611 | 68,483 | 39,611 |
| Total of capital commitments | 1,089,875 | 396,376 | 1,089,875 | 396,376 |
| Total commitments | 72,329,926 | 62,271,003 | 72,329,926 | 62,271,003 |
| Total contingent liabilities and commitments | 295,451,955 | 279,593,112 | 295,451,955 | 279,593,112 |
48.3 Commitments of Subsidiaries and Associates
48.3 (a) Contingencies of Subsidiaries
The Subsidiaries of the Group do not have any contingencies as at the year end.
48.3 (b) Contingencies of Associates
The Associates of the Group do not have any contingencies as at the year end.
49. Litigation Against the Bank
Litigation is a common occurrence in the banking industry due to the nature of the business. The Bank has an established protocol for dealing with such legal claims. In respect of pending legal claims where the Bank had already made provisions for possible losses in its Financial Statements or has a realisable security to cover the damages are not included below as the Bank does not expect cash outflows from such claims. However, further adjustments are made to Financial Statements if necessary on the adverse effects of legal claims based on the professional advice obtained on the certainty of the outcome based on a reasonable estimate.
Set out below are unresolved legal claims against the Bank as at December 31, 2013 for which adjustments to the Financial Statements have not been made due to the uncertainty of its outcome.
- Court action has been initiated by a third party in proceedings No. 0122/2009/DLM to claim the title of a property which has been mortgaged to the Bank by the present owner for several facilities granted. The value of action is Rs. 85.000 Mn. Written submissions of all parties are due on March 3, 2014. Court granted permission to amend the plaint as per the request made by the plaintiff, subject to a cost of Rs. 10,000.00 payable to each and every defendant.
- Court action has been initiated by a customer in proceedings No. 236/2011/MR challenging the Bank for transferring a vehicle in the name of a relation of the Plaintiff upon settlement of full amount due in respect of a lease facility obtained from the Bank. The Bank has executed the transfer on the strength of a letter issued by the Plaintiff who is challenging the letter. The value of the action is Rs. 3.500 Mn. Further trial is fixed for May 05, 2014.
- Court action has been initiated by a customer in proceeding number 25831/MR to claim a refund of Overdraft Interest amounting to Rs. 2.880 Mn. The Bank lost the case in the lower courts and now has appealed (Appeal No. 133/2010) to the Supreme Court. Arguments re-fixed for March 24, 2014.
- Court action has been initiated for BDT 9.153 Mn. (Rs. 15.452 Mn. approximately) in proceedings number 149/05 against the Credit Agricole Indusuez (Commercial Bank acquired Bangladesh operations from Credit Agricole Indusuez) and the Bank for the breach of contract due to improper termination of a contract between Credit Agricole Indusuez and the plaintiff on network facility provided for Electronic Fund Transfer (EFT). As the Bank was not a party to the contract, the Bank has filed a statement to the court requesting for a dismissal. Next date of the case has not been fixed by the court yet.
- Court action has been initiated by a third party in proceedings number 52/10 to claim a sum of BDT 35.328 Mn. (approx. Rs. 59.642 Mn.) from the Bank for illegal withdrawal of money from their account with forged signatures. The Bank is of the view that the Bank is not responsible for any losses occurring due to inadequacy of the security of cheque books. Next date of the case is fixed for March 11, 2014.
- Court action has been initiated by the plaintiff in proceedings number 571/2008/MR to prevent the Bank from exercising the right of lien and set off a deposit of the plaintiff amounting to US$ 15.000 Mn. against a claim made by the Bank in terms of a hedging Agreement. Commercial High Court issued the judgment in favour of the Bank and dismissed plaintiff’s application for an interim injunction. The parties have filed their initial pleadings and the matter is now fixed for Trial. Next trial date is February 24, 2014.
- Court action has been initiated by a customer in proceedings No. 36/96 (1) to claim a sum of Rs. 183.050 Mn. on account of a forward exchange contract. Judgment was delivered in favour of the Bank dismissing the plaintiff’s action but the plaintiff has appealed against the judgment in Supreme Court. The appeal is now fixed for argument on May 26, 2014.
- Court action has been initiated by a third party in proceedings number 112/2005(1) to claim Rs. 5.584 Mn. plus Rs. 10.000 Mn. as damages for disposing of the shares owned by her which were held under lien to the Bank. Plaintiff alleges that the transaction has taken place without obtaining her consent. Judgment was delivered in favour of the Plaintiff. Bank has appealed against the judgment delivered. The plaintiff has filed an application for the issue of Writ Pending Appeal. Bank had agreed to issue a guarantee for Rs. 5.000 Mn. in favour of plaintiff, to be claimed only on the final determination of the appeal file in Supreme Court. Accordingly, terms of settlement were recorded in courts.
50. Maturity Analysis
(a) Group
(i) Remaining contractual period to maturity as at the date of Statement of Financial Position of the assets employed by the Group is detailed below:
| Up to 3 Months |
3 to 1 2 Months |
1 to 3 Years |
3 to 5 Years |
More than 5 Years |
Total as at 31.12.2013 |
Total as at 31.12.2012 |
|
| Rs. ’000 | Rs. ’000 | Rs. ’000 | Rs. ’000 | Rs. ’000 | Rs. ’000 | Rs. ’000 | |
| Interest earning assets: | |||||||
| Cash and cash equivalents | 135,564 | – | – | – | – | 135,564 | 5,315,236 |
| Balances with Central Banks | 734 | 73 | – | – | – | 807 | 3,798 |
| Placements with banks | 4,131,814 | – | – | – | – | 4,131,814 | 16,162,970 |
| Other financial instruments held-for trading | 6,044,652 | – | – | – | – | 6,044,652 | 5,718,232 |
| Loans and receivables to banks | – | – | – | – | – | – | 95,000 |
| Loans and receivables to other customers | 178,948,201 | 60,777,855 | 115,477,158 | 43,096,409 | 20,644,592 | 418,944,215 | 372,857,337 |
| Financial investments - Available-for-sale | 33,508,356 | 67,404,741 | 8,962,927 | 10,828,935 | 2,994,403 | 123,699,362 | 57,923,774 |
| Total interest earning assets as at 31.12. 2013 | 222,769,321 | 128,182,669 | 124,440,085 | 53,925,344 | 23,638,995 | 552,956,414 | |
| Total interest earning assets as at 31.12. 2012 | 206,920,007 | 88,774,249 | 108,537,815 | 36,238,894 | 17,605,382 | 458,076,347 | |
| Non-interest earning assets: | |||||||
| Cash and cash equivalents | 14,127,969 | – | – | – | – | 14,127,969 | 14,436,969 |
| Balances with Central Banks | 12,239,128 | 5,247,753 | 332,558 | 296,785 | 314,905 | 18,431,129 | 18,164,241 |
| Derivative financial instruments | 396,311 | 441,067 | 316 | – | – | 837,694 | 1,351,095 |
| Other financial instruments held-for-trading | 334,406 | – | – | – | – | 334,406 | 322,878 |
| Loans and receivables to banks | – | – | 546,270 | – | – | 546,270 | 533,760 |
| Financial investments - Available-for-sale | – | – | – | 15,898 | 33,030 | 48,928 | 39,418 |
| Investments in associates | – | – | – | – | 94,173 | 94,173 | 93,712 |
| Property, plant & equipment | – | – | – | – | 9,175,225 | 9,175,225 | 8,946,881 |
| Intangible assets | – | – | – | – | 477,728 | 477,728 | 506,161 |
| Leasehold property | – | – | – | – | 110,324 | 110,324 | 111,776 |
| Deferred tax assets | 28,038 | 29,903 | 127,512 | 87,511 | 242,359 | 515,323 | 458,258 |
| Other assets | 5,641,299 | 207,188 | 483,175 | 442,444 | 2,762,577 | 9,536,683 | 9,179,144 |
| Total non-interest earning assets as at 31.12.2013 | 32,767,151 | 5,925,911 | 1,489,831 | 842,638 | 13,210,321 | 54,235,852 | |
| Total non-interest earning assets as at 31.12.2012 | 34,108,979 | 5,368,128 | 1,155,285 | 537,400 | 12,974,501 | 54,144,293 | |
| Total assets - as at December 31, 2013 | 255,536,472 | 134,108,580 | 125,929,916 | 54,767,982 | 36,849,316 | 607,192,266 | |
| Total assets - as at December 31, 2012 | 241,028,986 | 94,142,377 | 109,693,100 | 36,776,294 | 30,579,883 | 512,220,640 | |
| Percentage - as at December 31, 2013* | 42.08 | 22.09 | 20.74 | 9.02 | 6.07 | 100.00 | |
| Percentage - as at December 31, 2012* | 47.05 | 18.38 | 21.42 | 7.18 | 5.97 | 100.00 |
*Total percentage of each maturity bucket out of total assets employed by the Group.
(ii) Remaining contractual period to maturity as at the date of Statement of Financial Position of the liabilities and share holders’ funds employed by the group is detailed below:
| Up to 3 Months |
3 to 12 Months |
1 to 3 Years |
3 to 5 Years |
More than 5 Years |
Total as at 31.12.2013 |
Total as at 31.12.2012 |
||
| Rs. ’000 | Rs. ’000 | Rs. ’000 | Rs. ’000 | Rs. ’000 | Rs. ’000 | Rs. ’000 | ||
| Interest bearing liabilities: | ||||||||
| Due to banks | 9,575,006 | 2,620,000 | – | – | – | 12,195,006 | 1,354,651 | |
| Due to other customers | 268,750,885 | 124,388,355 | 8,158,766 | 6,461,491 | 7,568,542 | 415,328,039 | 358,505,365 | |
| Other borrowings | 26,434,100 | 14,416,936 | 5,235,806 | 5,030,065 | 2,880,596 | 53,997,503 | 47,565,945 | |
| Subordinated liabilities | 132,385 | 126,802 | 972,660 | – | 9,825,000 | 11,056,847 | 1,106,016 | |
| Total interest bearing liabilities as at 31.12.2013 | 304,892,376 | 141,552,093 | 14,367,232 | 11,491,556 | 20,274,138 | 492,577,395 | ||
| Total interest bearing liabilities as at 31.12.2012 | 265,924,501 | 108,514,627 | 10,299,962 | 11,395,522 | 12,397,365 | 408,531,977 | ||
| Non-interest bearing liabilities: | ||||||||
| Due to banks | 1,995,928 | 3,285 | – | – | – | 1,999,213 | 3,408,914 | |
| Derivative financial instruments | 1,035,182 | 376,734 | – | – | – | 1,411,916 | 84,291 | |
| Due to other customers | 35,770,907 | – | – | – | – | 35,770,907 | 32,063,317 | |
| Current tax liabilities | 1,082,016 | 698,851 | – | – | – | 1,780,867 | 2,821,975 | |
| Deferred tax liabilities | – | – | – | 1,673,415 | 605,322 | 2,278,737 | 1,889,983 | |
| Other provisions | 2,409 | – | – | – | – | 2,409 | 2,409 | |
| Other liabilities | 6,774,740 | 994,380 | 1,062,608 | 230,361 | 823,727 | 9,885,816 | 10,417,213 | |
| Stated capital | – | – | – | – | 19,586,813 | 19,586,813 | 18,008,796 | |
| Statutory reserves | – | – | – | – | 4,034,614 | 4,034,614 | 3,433,395 | |
| Retained earnings | – | – | – | – | 4,359,632 | 4,359,632 | 4,172,814 | |
| Other reserves | – | – | – | – | 33,465,169 | 33,465,169 | 27,353,415 | |
| Non-controlling interest | – | – | – | – | 38,778 | 38,778 | 32,141 | |
| Total non-interest bearing liabilities as at December 31, 2013 | 46,661,182 | 2,073,250 | 1,062,608 | 1,903,776 | 62,914,055 | 114,614,871 | ||
| Total non-interest bearing liabilities as at December 31, 2012 | 44,078,882 | 2,889,431 | 1,109,164 | 1,743,660 | 53,867,526 | 103,688,663 | ||
| Total liabilities and equity - as at 31.12.2013 | 351,553,558 | 143,625,343 | 15,429,840 | 13,395,332 | 83,188,193 | 607,192,266 | ||
| Total liabilities and equity - as at 31.12.2012 | 310,003,383 | 111,404,058 | 11,409,126 | 13,139,182 | 66,264,891 | 512,220,640 | ||
| Percentage - as at December 31, 2013* | 57.90 | 23.65 | 2.54 | 2.21 | 13.70 | 100.00 | ||
| Percentage - as at December 31, 2012* | 60.51 | 21.75 | 2.23 | 2.57 | 12.94 | 100.00 |
*Total percentage of each maturity bucket out of total liabilities and share holders' funds employed by the Group
(b) Bank
(i) Remaining contractual period to maturity as at the date of Statement of Financial Position of the assets employed by the Bank is detailed below:
| Up to 3 Months |
3 to 12 Months |
1 to 3 Years |
3 to 5 Years |
More than 5 Years |
Total as a t 31.12.2013 |
Total as at 31.12.2012 |
|
| Rs. ’000 | Rs. ’000 | Rs. ’000 | Rs. ’000 | Rs. ’000 | Rs. ’000 | Rs. ’000 | |
| Interest earning assets: | |||||||
| Cash and cash equivalents | 135,148 | – | – | – | – | 135,148 | 5,295,865 |
| Balances with Central Banks | 734 | 73 | – | – | – | 807 | 3,798 |
| Placements with banks | 4,131,814 | – | – | – | – | 4,131,814 | 16,162,970 |
| Other financial instruments held-for-trading | 6,044,652 | – | – | – | – | 6,044,652 | 5,718,232 |
| Loans and receivables to banks | – | – | – | – | – | – | 95,000 |
| Loans and receivables to other customers | 178,953,027 | 60,786,281 | 115,479,366 | 43,096,409 | 20,644,592 | 418,959,675 | 372,915,081 |
| Financial investments - Available-for-sale | 33,508,356 | 67,404,741 | 8,962,927 | 10,828,935 | 2,994,403 | 123,699,362 | 57,923,774 |
| Total interest earning assets as at 31.12.2013 | 222,773,731 | 128,191,095 | 124,442,293 | 53,925,344 | 23,638,995 | 552,971,458 | |
| Total interest earning assets as at 31.12.2012 | 206,909,722 | 88,798,920 | 108,561,802 | 36,238,894 | 17,605,382 | 458,114,720 | |
| Non-interest earning assets: | |||||||
| Cash and cash equivalents | 14,126,401 | – | – | – | – | 14,126,401 | 14,436,969 |
| Balances with Central Banks | 12,239,128 | 5,247,753 | 332,558 | 296,785 | 314,905 | 18,431,129 | 18,164,241 |
| Derivative financial instruments | 396,311 | 441,067 | 316 | – | – | 837,694 | 1,351,095 |
| Other financial instruments held-for-trading | 334,406 | – | – | – | – | 334,406 | 322,878 |
| Loans and receivables to banks | – | – | 546,270 | – | – | 546,270 | 533,760 |
| Financial investments - Available-for-sale | – | – | – | 15,898 | 33,030 | 48,928 | 39,418 |
| Investments in subsidiaries | – | – | – | – | 288,946 | 288,946 | 303,130 |
| Investments in associates | – | – | – | – | 44,331 | 44,331 | 44,331 |
| Property, plant & equipment | – | – | – | – | 8,387,344 | 8,387,344 | 8,221,118 |
| Intangible assets | – | – | – | – | 467,593 | 467,593 | 497,038 |
| Leasehold property | – | – | – | – | 76,362 | 76,362 | 77,304 |
| Deferred tax assets | 28,038 | 29,903 | 126,907 | 84,709 | 237,521 | 507,078 | 448,500 |
| Other assets | 5,643,781 | 207,188 | 483,175 | 442,444 | 2,762,577 | 9,539,165 | 9,188,206 |
| Total non-interest earning assets as at 31.12.2013 | 32,768,065 | 5,925,911 | 1,489,226 | 839,836 | 12,612,609 | 53,635,647 | |
| Total non-interest earning assets as at 31.12.2012 | 34,108,979 | 5,368,128 | 1,154,818 | 531,843 | 12,464,220 | 53,627,988 | |
| Total assets - as at December 31, 2013 | 255,541,796 | 134,117,006 | 125,931,519 | 54,765,180 | 36,251,604 | 606,607,105 | |
| Total assets - as at December 31, 2012 | 241,018,701 | 94,167,048 | 109,716,620 | 36,770,737 | 30,069,602 | 511,742,708 | |
| Percentage - as at December 31, 2013* | 42.12 | 22.11 | 20.76 | 9.03 | 5.98 | 100.00 | |
| Percentage - as at December 31, 2012* | 47.09 | 18.40 | 21.44 | 7.19 | 5.88 | 100.00 |
* Total percentage of each maturity bucket out of total assets employed by the Bank.
(ii) Remaining contractual period to maturity as at the date of Statement of Financial Position of the liabilities and shareholders’ funds employed by the Bank is detailed below:
| Up to 3 Months |
3 to 12 Months |
1 to 3 Years |
3 to 5 Years |
More than 5 Years |
Total as at 31.12.2013 |
Total as at 31.12.2012 |
|
| Rs. ’000 | Rs. ’000 | Rs. ’000 | Rs. ’000 | Rs. ’000 | Rs. ’000 | Rs. ’000 | |
| Interest bearing liabilities: | |||||||
| Due to banks | 9,575,006 | 2,620,000 | – | – | – | 12,195,006 | 1,354,651 |
| Due to other customers | 268,795,021 | 124,398,156 | 8,158,766 | 6,461,491 | 7,568,542 | 415,381,976 | 358,547,839 |
| Other borrowings | 26,594,769 | 14,431,939 | 5,235,806 | 5,030,065 | 2,880,596 | 54,173,175 | 47,713,199 |
| Subordinated liabilities | 132,385 | 126,802 | 972,660 | – | 9,825,000 | 11,056,847 | 1,106,016 |
| Total interest bearing liabilities as at 31.12.2013 | 305,097,181 | 141,576,897 | 14,367,232 | 11,491,556 | 20,274,138 | 492,807,004 | |
| Total interest bearing liabilities as at 31.12.2012 | 266,105,525 | 108,523,331 | 10,299,962 | 11,395,522 | 12,397,365 | 408,721,705 | |
| Non-interest bearing liabilities: | |||||||
| Due to banks | 1,995,928 | 3,285 | – | – | – | 1,999,213 | 3,408,914 |
| Derivative financial instruments | 1,035,182 | 376,734 | – | – | – | 1,411,916 | 84,291 |
| Due to other customers | 35,770,947 | – | – | – | – | 35,770,947 | 32,063,709 |
| Current tax liabilities | 1,059,723 | 698,851 | – | – | – | 1,758,574 | 2,801,541 |
| Deferred tax liabilities | – | – | – | 1,642,221 | 427,927 | 2,070,148 | 1,698,067 |
| Other provisions | 2,409 | – | – | – | – | 2,409 | 2,409 |
| Other liabilities | 6,736,452 | 994,380 | 1,060,576 | 228,329 | 807,472 | 9,827,209 | 10,362,808 |
| Due to subsidiaries | 15,686 | – | – | – | – | 15,686 | 22,264 |
| Stated capital | – | – | – | – | 19,586,813 | 19,586,813 | 18,008,796 |
| Statutory reserves | – | – | – | – | 4,034,614 | 4,034,614 | 3,433,395 |
| Retained earnings | – | – | – | – | 4,233,364 | 4,233,364 | 4,178,080 |
| Other reserves | – | – | – | – | 33,089,208 | 33,089,208 | 26,956,729 |
| Total non-interest bearing liabilities as at 31.12.2013 | 46,616,327 | 2,073,250 | 1,060,576 | 1,870,550 | 62,179,398 | 113,800,101 | |
| Total non-interest bearing liabilities as at 31.12.2012 | 44,026,699 | 2,889,431 | 1,109,164 | 1,713,754 | 53,281,955 | 103,021,003 | |
| Total liabilities and equity - as at 31.12.2013 | 351,713,508 | 143,650,147 | 15,427,808 | 13,362,106 | 82,453,536 | 606,607,105 | |
| Total liabilities and equity - as at 31.12.2012 | 310,132,224 | 111,412,762 | 11,409,126 | 13,109,276 | 65,679,320 | 511,742,708 | |
| Percentage - as at 31.12.2013* | 57.99 | 23.68 | 2.54 | 2.20 | 13.59 | 100.00 | |
| Percentage - as at 31.12.2012* | 60.61 | 21.77 | 2.23 | 2.56 | 12.83 | 100.00 |
* Total percentage of each maturity buckets out of total liabilities and shareholders’ funds employed by the Bank.
51. Employee Retirement Benefits
51.1 Pension Fund - Defined Benefit Plan
An actuarial valuation of the retirement Pension Fund was carried out as at December 31, 2013 by Mr. M Poopalanathan, AIA, Messrs Actuarial & Management Consultants (Pvt) Ltd., a firm of professional actuaries. The valuation method used by the actuaries to value the fund is the ‘Projected Unit Credit Method (PUC)‘, the method recommended by the Sri Lanka Accounting Standard LKAS 19 on ‘Employee Benefits’.
The assets of the fund, which are independently administered by the Trustees as per the provision of the Trust Deed are held separately from those of the Bank.
51.1 (a) Actuarial Assumptions - Demographic
Mortality
In service A 67/70 Mortality Table issued by the Institute of Actuaries, London
After retirement A (90) Annuities Table (Males & Females) issued by the Institute of Actuaries, London
Staff Turnover
The withdrawal rate at an age represents the probability of an active employee leaving within one year of that age due to reasons other than death, ill health and normal retirement. The same withdrawal rates which were used in the last valuation (December 31, 2012) to determine the liabilities of the active employees in the funded scheme, were used in the actuarial valuation as at December 31, 2013.
Disability
Assumptions similar to those used in other comparable schemes for disability were used as the data required to do a ‘scheme specific’ study was not available.
Normal Retirement Age
55 or 60 years as indicated in the data file of active employees.
51.1 (b) Actuarial Assumptions - Financial
Rate of Discount
In the absence of a deep market in long-term Bonds in Sri Lanka, a long-term rate of 10% p.a. (2012 - 11% p.a.) has been used to discount future liabilities considering anticipated long-term rate of inflation.
Salary Increases
A salary increment of 9% p.a. (2012 - 10% p.a.) has been used in respect of the active employees.
Post-Retirement Pension Increase Rate
There is no agreed rate of increase even though the pension payments are subject to periodic increases, and increases are given solely at the discretion of the Bank. Therefore, no specific rate was assumed for this valuation.
| 2013 | 2012 | |
| Rs. ’000 | Rs. ’000 | |
51.1 (c) Movement in the Present Value of Defined Benefit Obligations |
||
| Opening balance | 112,014 | 91,937 |
| Interest cost | 12,321 | 9,194 |
| Current service cost | 2,102 | 2,325 |
| Benefits paid during the year | (8,119) | (7,000) |
| Actuarial loss | 6,360 | 15,558 |
| Closing balance | 124,678 | 112,014 |
| 2013 | 2012 | |
| Rs. ’000 | Rs. ’000 | |
51.1 (d) Movement in the Fair Value of Plan Assets |
||
| Fair value as at the beginning of the year | 94,899 | 85,845 |
| Expected return on plan assets | 10,439 | 8,584 |
| Contribution paid into plan | 1,411 | 1,704 |
| Benefits paid by the plan | (8,119) | (7,000) |
| Actuarial gain on plan assets | 19,270 | 5,766 |
| Fair value as at the end of the year | 117,900 | 94,899 |
51.1 (e) Liability Recognised in the Statement of Financial Position
| Present value of defined benefit obligations as at the end of the year | 124,678 | 112,014 |
| Fair value of plan assets as at the end of the year | (117,900) | (94,899) |
| Unrecognised actuarial gains/(losses) | – | – |
| Net liability recognised in the Statement of Financial Position | 6,778 | 17,115 |
51.1 (f) Plan Assets Consist of the Following:
| Government Treasury Bills | 42,512 | 38,632 |
| Deposits held with the Bank | 75,388 | 56,267 |
| Total | 117,900 | 94,899 |
52. Operating Segments
The group has the following strategic divisions which are reportable segments. These divisions offer different products and services and are managed separately based on the group’s management and internal reporting structure.
The following table presents the income, profit and asset and liability information on the Group’s business segments for the year ended December 31, 2013 and comparative figures for the year ended December 31, 2012.
| Banking | Leasing | Dealing/Treasury | Investments | Total/Consolidated | ||||||
| For the year ended December 31, | 2013 | 2012 | 2013 | 2012 | 2013 | 2012 | 2013 | 2012 | 2013 | 2012 |
| Rs. ’000 | Rs. ’000 | Rs. ’000 | Rs. ’000 | Rs. ’000 | Rs. ’000 | Rs. ’000 | Rs. ’000 | Rs. ’000 | Rs. ’000 | |
| External operating income: | ||||||||||
| Net interest income | 22,240,114 | 21,385,560 | 944,807 | 911,261 | 1,648,811 | 111,621 | 488,525 | 443,217 | 25,322,257 | 22,851,659 |
| Foreign exchange profit | 3,715,933 | 2,091,074 | – | – | (1,720,316) | 2,595,937 | – | – | 1,995,617 | 4,687,011 |
| Net fees and commission income | 4,244,029 | 3,590,315 | – | – | 8,829 | 8,003 | – | – | 4,252,858 | 3,598,318 |
| Other income | 2,539,281 | 1,360,254 | 121,122 | 58,940 | 214,756 | 131,168 | 42,955 | 60,369 | 2,918,114 | 1,610,731 |
| Operating income by segment | 32,739,357 | 28,427,203 | 1,065,929 | 970,201 | 152,080 | 2,846,729 | 531,480 | 503,586 | 34,488,846 | 32,747,719 |
| Eliminations/unallocated | 1,130,093 | 266,169 | ||||||||
| Total operating income | 35,618,939 | 33,013,888 | ||||||||
| Credit loss expenses | (4,274,451) | (3,083,820) | (325,881) | (74,471) | – | – | – | – | (4,600,332) | (3,158,291) |
| Net operating income | 28,464,906 | 25,343,383 | 740,048 | 895,730 | 152,080 | 2,846,729 | 531,480 | 503,586 | 31,018,607 | 29,855,597 |
| Segment result | 16,069,622 | 15,702,646 | 740,048 | 895,730 | 1,751,483 | 1,617,091 | 474,559 | 449,652 | 19,035,712 | 18,665,119 |
| Unallocated operating expenses | (4,350,079) | (4,364,565) | ||||||||
| Operating profit | 14,685,633 | 14,300,554 | ||||||||
| Share of profit of associates - (before tax) | 7,118 | 12,360 | ||||||||
| Income tax expense | (4,119,294) | (4,231,747) | ||||||||
| Non-controlling interest | (10,079) | (1,338) | ||||||||
| Net profit for the year, attributable to equity holders of the Parent | 10,563,378 | 10,079,829 | ||||||||
| Banking | Leasing | Dealing/Treasury | Investments | Total/Consolidated | ||||||
| As at December 31, | 2013 | 2012 | 2013 | 2012 | 2013 | 2012 | 2013 | 2012 | 2013 | 2012 |
| Rs. ’000 | Rs. ’000 | Rs. ’000 | Rs. ’000 | Rs. ’000 | Rs. ’000 | Rs. ’000 | Rs. ’000 | Rs. ’000 | Rs. ’000 | |
| Other information | ||||||||||
| Segment assets | 335,270,625 | 291,972,329 | 21,778,745 | 25,043,149 | 192,541,792 | 132,898,416 | 4,996,180 | 3,836,916 | 554,587,342 | 453,750,810 |
| Investments in associates | – | – | – | – | – | – | 94,173 | 93,712 | 94,173 | 93,712 |
| Unallocated assets | – | – | – | – | – | – | – | – | 52,510,751 | 58,376,118 |
| Total assets | 335,270,625 | 291,972,329 | 21,778,745 | 25,043,149 | 192,541,792 | 132,898,416 | 5,090,353 | 3,930,628 | 607,192,266 | 512,220,640 |
| Segment liabilities | 322,236,766 | 292,636,055 | 21,778,745 | 25,043,149 | 192,541,792 | 132,898,416 | 5,090,353 | 3,930,628 | 541,647,656 | 454,508,248 |
| Unallocated liabilities | – | – | – | – | – | – | – | 4,059,604 | 4,711,831 | |
| Total liabilities | 322,236,766 | 292,636,055 | 21,778,745 | 25,043,149 | 192,541,792 | 132,898,416 | 5,090,353 | 3,930,628 | 545,707,260 | 459,220,079 |
| Banking | Leasing | Dealing/Treasury | Investments | Total/ Consolidated | ||||||
| For the year ended December 31, | 2013 | 2012 | 2013 | 2012 | 2013 | 2012 | 2013 | 2012 | 2013 | 2012 |
| Rs. ’000 | Rs. ’000 | Rs. ’000 | Rs. ’000 | Rs. ’000 | Rs. ’000 | Rs. ’000 | Rs. ’000 | Rs. ’000 | Rs. ’000 | |
| Information on cash flows | ||||||||||
| Cash flows from operating activities | 51,449,579 | 10,402,702 | 3,409,503 | (3,660,659) | 805,457 | (301,398) | (64,543,946) | 3,976,690 | (8,879,407) | 10,417,335 |
| Cash flows from investing activities | – | – | – | – | – | – | (1,025,995) | 471,849 | (1,025,995) | 471,849 |
| Cash flows from financing activities | 9,464,350 | – | – | – | (132,645) | (132,429) | – | – | 9,331,705 | (132,429) |
| Capital expenditure- | ||||||||||
| Property, plant & equipment | – | – | – | – | – | – | – | – | (925,721) | (1,157,138) |
| Intangible assets | – | – | – | – | – | – | – | – | (119,903) | (202,433) |
| Eliminations/ unallocated | – | – | – | – | – | – | – | – | (3,869,351) | (2,579,974) |
| Net cash flow generated during the year | (5,488,672) | 6,817,210 | ||||||||
Geographical Segments
The following table presents the distribution of total assets, income, profit before tax and profit after tax of the Group/Bank by geographical segment, allocated based on the location in which the transaction assets and liabilities are recorded for the year ended December 31, 2013 together with comparative figures for the year ended December 31, 2012.
| GROUP | BANK | |||||||
| 2013 | 2012 | 2013 | 2012 | |||||
| Rs. ’000 | % | Rs. ’000 | % | Rs. ’000 | % | Rs. ’000 | % | |
| Assets | ||||||||
| Sri Lankan operations | 561,016,955 | 92.40 | 471,153,270 | 91.98 | 560,465,291 | 92.39 | 470,726,049 | 91.98 |
| International operations | 46,175,311 | 7.60 | 41,067,370 | 8.02 | 46,141,814 | 7.61 | 41,016,659 | 8.02 |
| Total | 607,192,266 | 100.00 | 512,220,640 | 100.00 | 606,607,105 | 100.00 | 511,742,708 | 100.00 |
| Income | ||||||||
| Sri Lankan operations | 67,430,397 | 92.24 | 58,574,030 | 92.43 | 67,492,236 | 92.25 | 58,595,750 | 92.43 |
| International operations | 5,670,981 | 7.76 | 4,799,723 | 7.57 | 5,667,344 | 7.75 | 4,799,297 | 7.57 |
| Total | 73,101,378 | 100.00 | 63,373,753 | 100.00 | 73,159,580 | 100.00 | 63,395,047 | 100.00 |
| Profit before tax | ||||||||
| Sri Lankan operations | 12,437,041 | 84.65 | 12,416,243 | 86.75 | 12,229,347 | 84.28 | 12,358,802 | 86.45 |
| International operations | 2,255,710 | 15.35 | 1,896,671 | 13.25 | 2,281,172 | 15.72 | 1,936,531 | 13.55 |
| Total | 14,692,751 | 100.00 | 14,312,914 | 100.00 | 14,510,519 | 100.00 | 14,295,333 | 100.00 |
| Profit after tax | ||||||||
| Sri Lankan operations | 9,212,231 | 87.13 | 9,061,030 | 89.88 | 9,058,823 | 86.72 | 9,038,332 | 89.50 |
| International operations | 1,361,226 | 12.87 | 1,020,137 | 10.12 | 1,386,688 | 13.28 | 1,059,997 | 10.50 |
| Total | 10,573,457 | 100.00 | 10,081,167 | 100.00 | 10,445,511 | 100.00 | 10,098,329 | 100.00 |
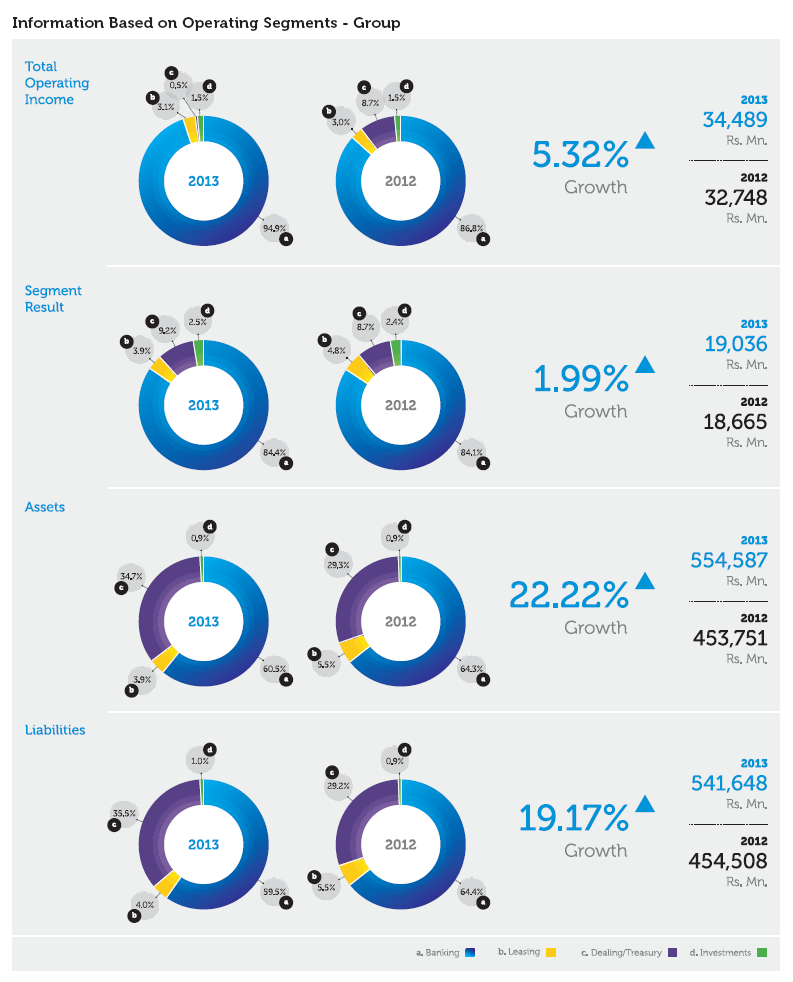
53. Related Party Disclosures
The Bank carried out transactions in the ordinary course of business on an arm’s length basis at commercial rates with parties who are defined as Related Parties as per the Sri Lanka Accounting Standard - LKAS 24 ‘Related Party Disclosures’, except for the transactions that Key Management Personnel (KMPs) have availed under schemes uniformly applicable to all staff at concessionary rates.
53.1 Parent and Ultimate Controlling Party
The Bank does not have an identifiable parent of its own.
53.2 Transactions with Key Management Personnel (KMPs)
Key Management Personnel are those persons having authority and responsibility for planning, directing and controlling the activities of the Bank directly or indirectly.
Accordingly the Bank’s KMPs include the Board of Directors (including Executive and Non-Executive Directors) and selected key employees who meet the criteria above.
Close Family Members (CFM) of a KMP are those family members who may be expected to influence, or be influenced by, that KMP in their dealings with the Bank. They may include KMPs domestic partner and children, children of the KMPs domestic partner and dependants of the KMP or the KMPs domestic partner.
As the Bank is the ultimate parent of the Subsidiaries, the Board of Directors of the Bank have the authority and responsibility for planning, directing and controlling the activities of the Group directly or indirectly. Accordingly the Board of Directors of the Bank (Including Executive and Non-Executive) are also KMPs of the Group.
53.2.1.1 Compensation of Directors - Bank
| 2013 | 2012 | |
| Rs. ’000 | Rs. ’000 | |
| Short term employment benefits | 91,590 | 92,869 |
| Post-employment benefits | 5,463 | 6,459 |
| Total | 97,053 | 99,328 |
53.2.1.2 Compensation of other KMPs - Bank
| Short term employment benefits | 170,457 | 161,328 |
| Post-employment benefits | 18,073 | 16,960 |
| Total | 188,530 | 178,288 |
53.2.1.3 Compensation of KMPs - Group
| Short term employment benefits | 91,912 | 93,169 |
| Post-employment benefits | 5,463 | 6,459 |
| Total | 97,375 | 99,628 |
In addition to the above the Bank/Group provide non-cash benefits to the KMPs.
53.2.2 Transactions, Arrangements and Agreements Involving KMPs, and their Close Family Members (CFMs)
CFMs of a KMP are those family members who may be expected to influence, or be influenced by, that KMP in their dealings with the entity. They may include KMPs domestic partner and children, children of the KMPs domestic partner and dependents of the KMP or the KMPs domestic partner.
53.2.2.1 Statement of Financial Position - Bank
| Year-end Balance | Average Balance | |||
| 2013 | 2012 | 2013 | 2012 | |
| Rs. ’000 | Rs. ’000 | Rs. ’000 | Rs. ’000 | |
| Assets | ||||
| Loans and advances | 89,564 | 87,789 | 90,286 | 86,625 |
| Credit cards | 722 | 1,774 | 1,704 | 194 |
| Total | 90,286 | 89,563 | 91,990 | 86,819 |
| Liabilities | ||||
| Deposits | 176,362 | 154,173 | 163,139 | 175,844 |
| Securities sold under re-purchase agreements | 32,120 | 34,014 | 33,920 | 118,872 |
| Debentures | 200 | 200 | 200 | 200 |
| Total | 208,682 | 188,387 | 197,259 | 294,916 |
53.2.2.2 Commitments and Contingencies - Bank
| Letters of credit | – | – | – | 359 |
| Undrawn facilities | 21,255 | 26,488 | 30,227 | 28,757 |
| Total | 21,255 | 26,488 | 30,227 | 29,116 |
53.2.2.3 Direct and Indirect Accommodation - Bank
| Direct and indirect accommodation as a % of the Bank’s Regulatory Capital | 0.17% | 0.24% |
No impairment losses have been recorded against balances outstanding during the period with KMP, and no specific provision has been made for impairment losses on balances with KMP and their CFMs.
53.2.2.4 Income Statement
| For the Year Ended | ||
| 2013 | 2012 | |
| Rs. ’000 | Rs. ’000 | |
| Interest income | 8,715 | 8,186 |
| Interest expenses | 20,870 | 26,175 |
| Other income | 177 | 111 |
| Compensation to KMPs [Refer Notes 53.2.1.1 and 53.2.1.2] | 285,583 | 277,616 |
53.2.2.5 Share-Based Benefits to KMPs
| As at the Year End | ||
| 2013 | 2012 | |
| Number of ordinary shares held | 3,848,833 | 4,030,871 |
| Dividends paid (In Rs. ’000) | 28,144 | 34,158 |
| Number of cumulative exercisable options under the Employee Share Option Plan (ESOP) 2008 - Tranche I | 532,196 | 817,581 |
| Tranche II | 324,719 | 387,828 |
| Tranche III | 422,500 | – |
53.3 Transactions with Group Entities
The Group entities include the Subsidiaries and Associates of the Bank.
53.3.1 Transactions with Subsidiaries
53.3.1.1 Statement of Financial Position
| Year-end Balance | Average Balance | |||
| 2013 | 2012 | 2013 | 2012 | |
| Rs. ’000 | Rs. ’000 | Rs. ’000 | Rs. ’000 | |
| Assets | ||||
| Loans and advances | – | 343 | 1,478 | 1,503 |
| Lease receivable | 16,965 | 57,401 | 32,736 | 89,051 |
| Other | 34,504 | 37,859 | 36,181 | 52,120 |
| Total | 51,469 | 95,603 | 70,395 | 142,674 |
| Liabilities | ||||
| Deposits | 53,937 | 42,866 | 60,395 | 61,786 |
| Securities sold under re–purchase agreements | 175,672 | 142,721 | 174,998 | 113,053 |
| Other | 15,686 | 22,264 | 18,975 | 18,632 |
| Total | 245,295 | 207,851 | 254,368 | 193,471 |
53.3.1.2 Commitments and Contingencies
| Undrawn facilities | – | 25,000 | 15,638 | 20,833 |
| Total | – | 25,000 | 15,638 | 20,833 |
53.3.1.3 Direct and Indirect Accommodation
| Direct and indirect accommodation as a % of the Bank’s Regulatory Capital | 0.03% | 0.17% |
53.3.1.4 Income Statement
| For the Year Ended | ||
| 2013 | 2012 | |
| Rs. ’000 | Rs. ’000 | |
| Interest income | 7,244 | 20,189 |
| Interest expenses | 23,550 | 19,092 |
| Other income | 70,465 | 70,437 |
| Expenses paid | 345,007 | 246,574 |
53.3.1.5 Other Transactions
| Payments made to ONEzero Company Ltd. in relation to purchase of computer hardware, software and maintenance agreements | 99,877 | 168,691 |
53.3.2 Transactions with Associates
53.3.2.1 Statement of Financial Position
| Year-end Balance | Average Balance | |||
| 2013 | 2012 | 2013 | 2012 | |
| Rs. ’000 | Rs. ’000 | Rs. ’000 | Rs. ’000 | |
| Assets | ||||
| Loans and advances | 11 | 11,570 | 22 | 12,232 |
| Lease receivables | 1,010 | 2,600 | 3,988 | 4,962 |
| Total | 1,021 | 14,170 | 4,010 | 17,194 |
| Liabilities | ||||
| Deposits | 78,600 | 52,707 | 43,087 | 83,048 |
| Securities sold under re-purchase agreements | 6,840 | 4,096 | 14,300 | 17,393 |
| Total | 85,440 | 56,803 | 57,387 | 100,441 |
53.3.2.2 Direct and Indirect Accommodation
| Direct and indirect accommodation as a % of the Bank’s Regulatory Capital | 0.00% | 0.03% |
53.3.2.3 Income Statement
| For the Year Ended | ||
| 2013 | 2012 | |
| Rs. ’000 | Rs. ’000 | |
| Interest income | 615 | 2,773 |
| Interest expenses | 6,112 | 11,507 |
| Other income | 28,885 | 55,971 |
53.3.2.4 Other Transactions
| Number of ordinary shares held as at the year end | 4,408 | 4,246 | |
| Dividend paid (Rs. ’000) | 28 | 21 |
53.4 Transactions with Other Related Entities
Other related entities include significant investors (either entities or individuals) that have control, joint control or significant influence, post-employment benefit plans for the Bank’s employees.
53.4.1 Transactions with the Post-Employment Benefit Plans for the Employees of the Bank
53.4.1.1 Statement of Financial Position
| Year-end Balance | Average Balance | |||
| 2013 | 2012 | 2013 | 2012 | |
| Rs. ’000 | Rs. ’000 | Rs. ’000 | Rs. ’000 | |
| Assets | ||||
| Loans and Advances | – | – | – | – |
| Total | – | – | – | – |
| Liabilities | ||||
| Deposits | 2,296,724 | 1,592,507 | 1,512,629 | 1,198,568 |
| Securities sold under repurchase agreements | 60,042 | 141,160 | 11,906 | 75,644 |
| Total | 2,356,766 | 1,733,667 | 1,524,535 | 1,274,212 |
53.4.1.2 Income Statement
| For the Year Ended | ||
| 2013 | 2012 | |
| Rs. ’000 | Rs. ’000 | |
| Interest income | – | – |
| Interest expenses | 197,602 | 136,174 |
| Contribution made/taxes paid by the Bank | 795,675 | 782,339 |
54. Events After the Reporting Period
No circumstances have arisen since the reporting date which would require adjustments to or disclosure in the Financial Statements other than those disclosed below:
54.1 Second Interim Dividend - 2013
The Bank declared and paid a second interim dividend of Rs. 1.00 per share on January 27, 2014 to both the voting and non-voting ordinary shareholders of the Bank.
54.2 Final Dividend - 2013
The Board of Directors of the Bank have recommended the payment of a final dividend of Rs. 4.00 per share which consist of a cash dividend. Rs. 2.00 per share and the balance entitlement of Rs. 2.00 per share that will be satisfied in the form of issue and allotment of new shares for both the voting and non-voting ordinary shareholders of the Bank for the year ended December 31, 2013. (Further, this dividend is to be approved at the Annual General Meeting to be held on March 31, 2014). In accordance with the Sri Lanka Accounting Standard 10 on ‘Events after the Reporting Period’. The above second interim dividend and the proposed final dividend for 2013 have not been recognised as a liabilities as at December 31, 2013. Under the Inland Revenue Act No. 10 of 2006, a withholding tax of 10% has been imposed on dividends declared.
Compliance with Sections 56 and 57 of Companies Act No. 07 of 2007
As required by Section 56 of the Companies Act No. 07 of 2007, the Board of Directors of the Bank satisfied the solvency test in accordance with Section 57, prior to recommending the final dividend. A statement of solvency completed and duly signed by the Directors on February 25, 2014 has been audited by KPMG Sri Lanka.
55. Net Assets Value Per Ordinary Share
| GROUP | BANK | |||
| 2013 | 2012 | 2013 | 2012 | |
| Rs. ’000 | Rs. ’000 | Rs. ’000 | Rs. ’000 | |
| Amounts used as the numerator: | ||||
| Total equity attributable to equity holders of the Bank | 61,446,228 | 52,968,420 | 60,943,999 | 52,577,000 |
| Number of ordinary shares used as the denominator: | ||||
| Total number of shares | 849,079,041 | 833,487,980 | 849,079,041 | 833,487,980 |
| Net assets value per share | 72.37 | 63.55 | 71.78 | 63.08 |
56. Financial Risk Management
This note presents information about the Bank’s exposure to financial risks and the Bank’s management of capital.
| Credit risk: |
| (A) Analysis of credit quality |
| (B) Credit concentration risk |
| (C) Collateral held and their financial effect |
| (D) Impaired loans and receivables |
| Market risk |
| Liquidity risk |
| Capital management |
Bank’s Financial Risk Management Framework
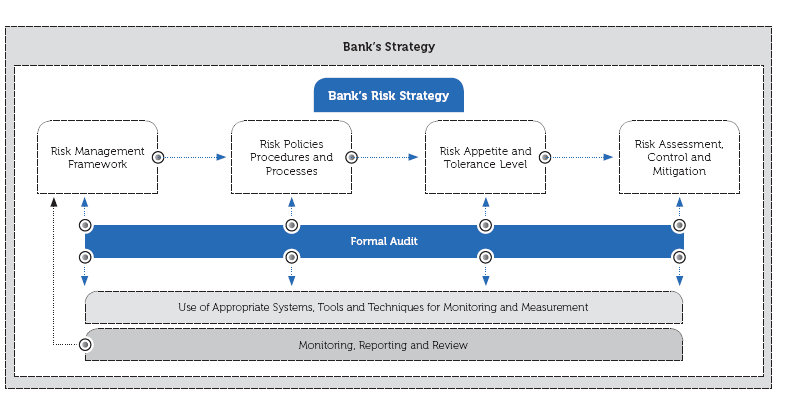
The Risk Management Framework of the Bank has been optimised through the application and the embedment of the risk management processes including risk identification, risk assessment/risk measurement, risk monitoring, risk mitigation and risk control.
By using appropriate systems, tools and procedures, all the components of the risk framework are subject to continuous monitoring and review, including formal audits to ensure integrity of the overall risk management function.
The Bank identifies the following key financial risks in its business operations:
- Credit Risk
- Market Risk
- Liquidity Risk
- Capital Management
| Key Risk Area | Risk Management Process |
| Credit Risk | Apart from the risk identification, risk evaluation and risk mitigations adopted by the Lending Officers as the ‘risk owners’, Credit Risk is managed at the Bank in two fronts. Pre disbursement evaluation of credit proposals above a certain threshold level is employed to provide an independent insight to the credit proposals. Risk approval is being provided with independent assessment on the proposal to facilitate approving authority to have a broader understanding of the credit proposal prior to sanctioning. Post disbursement Credit Risk Reviews are being carried out to ensure adherence to Credit Policy and Lending Guidelines of the Bank in general and to ascertain adoption of uniform practices throughout the Bank with a view to maintain and preserve the quality of credit portfolios while inculcating a sound credit culture. |
| Market Risk/Liquidity Risk | Middle Office and Market Risk Management Unit of the Bank is entrusted with independently identifying risk factors associated with the market volatilities in addition to the roles played by the Treasury Front Office as the primary ‘risk owners’. The management process includes monitoring and reporting in addition to carrying out scenario analysis/stress testing on market factors to facilitate proactive decision making. Liquidity risk too is managed by the Bank under the supervision of the ALCO, by using threshold levels and Management Action Triggers through policy framework supported by a robust MIS. |
| Capital Management | The Bank realises the importance of managing capital as it restricts the business growth unlike any other commercial organisation. All large credit proposals are evaluated with the capital charge and lending decisions are taken on the basis of sufficient return on capital. Even the expansion projects in terms of new buildings and software purchases are evaluated against sufficient return on capital. The Bank always maintains a relatively higher level of free capital which will be utilised for lending activities thereby improving the net interest income of the Bank. Further, the Bank also maintains an effective balance between dividend payment and retention of profits ensuring sufficient plough back of profits. |
Credit Risk:
The Bank strives to optimise a well structured credit risk management process through assessing, evaluating, pricing, mitigating, monitoring and managing credit risk in a consistent manner. Bank’s general policy is to assume credit exposures with short to medium-term maturities. This reduces the overall credit risk in the portfolios to a great extent.
(A) Analysis of Credit Quality:
(i) Loans and Receivables
The table below sets out the information about the credit quality of financial assets and the allowance for impairment held by the Bank against those assets.
| Credit Quality Analysis | Internal | Loans and Receivables to Other Customers |
Loans and Receivables to Banks | ||
| Risk Grade | 2013 | 2012 | 2013 | 2012 | |
| Rs. ’000 | Rs. ’000 | Rs. ’000 | Rs. ’000 | ||
| Maximum exposure to credit risk | |||||
| Carrying amount | 418,959,675 | 372,915,081 | 546,270 | 628,760 | |
| Amount committed/guaranteed | |||||
| 418,959,675 | 372,915,081 | 546,270 | 628,760 | ||
| At amortised cost | |||||
| Risk grading: | |||||
| Very Good - Average | 0-6 & G | 414,550,983 | 370,794,319 | 546,270 | 628,760 |
| Special mention | S | 2,251,920 | 3,149,428 | – | – |
| Substandard | 7 | 3,208,215 | 1,738,362 | ||
| Doubtful | 8 | 2,192,363 | 1,043,926 | – | – |
| Loss | 9 | 12,543,359 | 9,690,273 | – | – |
| Total gross amount | 434,746,840 | 386,416,308 | 546,270 | 628,760 | |
| Allowance for impairment | 15,787,165 | 13,501,227 | – | – | |
| Net carrying amount | 418,959,675 | 372,915,081 | 546,270 | 628,760 | |
(ii) Held-for-Trading Financial Instruments
The trading portfolio of the Bank’s Sri Lankan operations mainly consists of Government Securities (Rs. 4.06 Bn.), selective trading being carried out on other marketable securities such as Debentures and shares. Distribution of such trading portfolio based on Fitch Rating or equivalent ratings as at December 31, 2013 is given below:
| Fitch Rating Nomenclature or Equivalent | Trading Portfolio - Shares as at December 31, 2013 Rs. ’000 |
| A | 35,656 |
| AA- | 4,310 |
| AAA | 73,312 |
| Unrated | 221,129 |
| Total | 334,407 |
The Bank does not have any counterparty credit exposure arising from derivative transactions.
(iii) Non-Performing Asset Ratio
The distribution of the credit portfolio based on the internal rating system adopted by the Bank indicates that as of December 31, 2013, 96% of the loans and receivables are rated 0-6 (i.e. Average/Generally Accepted) or above, indicating a healthy Loans and Receivables portfolio.
NPA percentage movement which depicts the quality of credit portfolio of the Bank over the past 2-year period is given below:
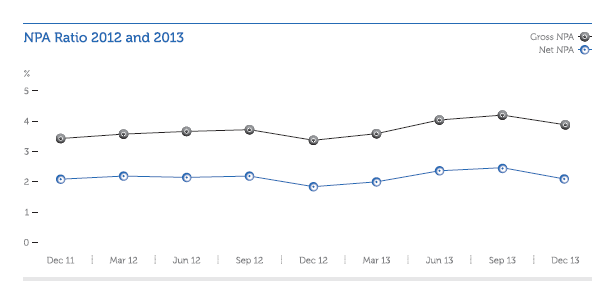
NPA ratios are calculated on gross and net basis. Gross NPA advances including interest receivable on NPA and net of interest in suspense forms the numerator (considering the loans and receivables rated risk gradings 7,8,9) of the gross NPA ratio. Net NPA is arrived after discounting the specific provision from the gross NPA as calculated above to form the numerator of the Net NPA ratio.
Denominator of both ratios consists of total advances including the interest receivable net of interest in suspense.
(B) Credit Concentration Risk:
The Bank considers maintaining credit concentration risk at appropriate levels as a key component of its overall credit risk management process.
The Bank’s loan portfolio spreads over a well diversified range of products with different risk profiles. Even though the long-term loans (loans having remaining term to maturity periods over 12 months) appear to be the major part of the portfolio, these loans are granted to a diversified pool of borrowers across different industry segments thus reducing potential concentration risks. The majority of such loans have remaining term to maturity periods less than 5 years. Although Western Province is vested with highest credit concentration, we believe that a sizable portion of these lending has been utilised to facilitate industries scattered around the country. For example, most of the large corporates which have island-wide operations are being accommodated by the Branches and Corporate Banking Division situated in the Western Province thus reflecting a fairly diversified geographical concentration on such borrowers.
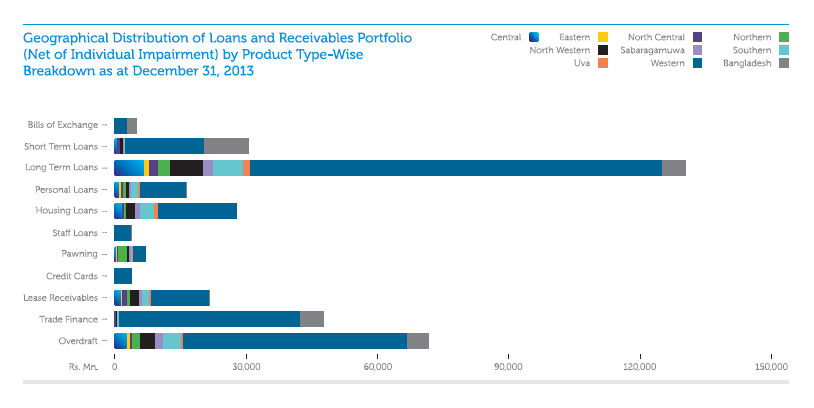
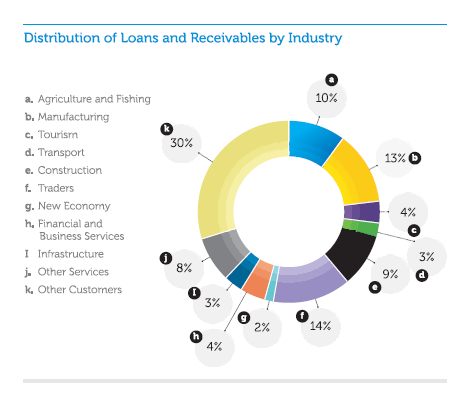
Country-wise Exposure
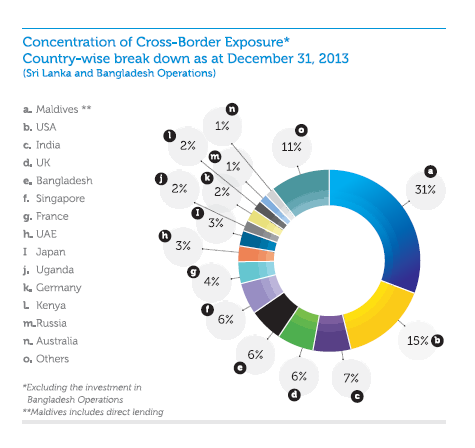
(C) Collateral Held and Their Financial Effect
As a general principle, the Bank endeavours to obtain adequate collateral to secure its credit portfolios. The Bank focuses on quality and realisability of such collateral to mitigate potential credit losses. A reasonable margin of safety is maintained in collateral values which are reviewed at frequent intervals.
Cash, marketable securities and property mortgages (residential and commercial) account for a major portion of the collateral portfolios. Out of these collaterals, eligible financial collateral and mitigants in computing Basel II related credit risk exposures are given below:
| Eligible Financial Collaterals/Mitigants | Value of Collateral (Rs. Bn.) |
| Cash | 34.4 |
| Gold | 6.5 |
| Government Securities | 1.6 |
| Residential Properties | 31.6 |
| Shares (Rated) | 9.1 |
| Guarantees (Rated) - Corporate/Bank/Government | 5.4 |
| Provident Fund Balances | 0.1 |
| Total | 88.7 |
The Bank always strives to adopt prudential norms in deciding the Loan to Value (LTV) ratio when collaterals are considered as a means of credit risk mitigatory measure to safeguard the interest of the Bank in an eventuality.
Forced Sale Value (FSV) of the assets obtained by the Bank by taking possession of collateral held as security against loans and advances and held in possession as at December 31, 2013 is Rs. 579.7 Mn. Out of these, properties having FSV of Rs. 91.6 Mn. are readily available for disposal free of legal encumbrances.
(D) Impaired Loans and Receivables
The table below sets out reconciliation of changes in the carrying amount of individually impaired loans and receivables to customers.
| 2013 | 2012 | |
| Rs. ’000 | Rs. ’000 | |
| Impaired loans and advances to other customers at January 1, | 2,569,121 | 2,108,544 |
| Classified as impaired during the year | 2,238,689 | 1,649,436 |
| Change in provision for impairment | (3,021,394) | (1,296,697) |
| Net payment, write-off and recoveries and other movement during the year | 811,958 | 107,837 |
| Impaired loans and advances to other customers at December 31, | 2,598,374 | 2,569,121 |
For details of impairment for loans and receivables to customers, see Note 26.2.
Set out below is an analysis of the gross (Net of provision for impairment) amounts of individually impaired loans and receivables by risk grade.
| Loans and Receivables to Customers |
|||
| Internal Risk Grade | Gross | Net | |
| Rs. ’000 | Rs. ’000 | ||
| December 31, 2013 | |||
| Risk grading: | |||
| Very Good - Average | 0-6 & G | 653,836 | 297,306 |
| Special mention | S | 215,859 | 125,664 |
| Substandard | 7 | 1,032,094 | 752,983 |
| Doubtful | 8 | 618,735 | 425,823 |
| Loss | 9 | 4,282,500 | 996,597 |
| Total | 6,803,024 | 2,598,374 | |
| December 31, 2012 | |||
| Risk grading: | |||
| Very Good - Average | 0-6 & G | 1,860,856 | 1,011,367 |
| Special mention | S | 369,610 | 166,913 |
| Substandard | 7 | 168,638 | 94,934 |
| Doubtful | 8 | 212,308 | 142,694 |
| Loss | 9 | 3,359,873 | 1,153,213 |
| Total | 5,971,285 | 2,569,121 | |
Market Risk:
Market risk encompasses Interest Rate Risk, Foreign Exchange Risk, Commodity Risk and Equity Risk that may arise as a result of change in the financial market conditions such as change in interest rates, change in Foreign Exchange rates, change in commodity prices or change in share prices.
Out of the risks listed above under market risk, Interest Rate Risk is considered as the major risk in this category followed by the Foreign Exchange Risk due to the inherent nature of the Statement of Financial Position of the Bank. As the Bank’s equity portfolio is nominal compared to the total market risk exposures and due to the fact that the Bank refrains from trading in commodities, these two risk types do not significantly expose the Bank to uncertainties in its earnings and/or capital.
The Bank carries a trading book mainly consisting of Government Securities and therefore volatilities in interest rates could impact the profitability of the Bank. However, processes are in place to independently mark to market these portfolios on a daily basis to make timely decisions to minimise any large adverse impact.
(A) Sensitivity Analysis
The graph below depicts the sensitivity analysis carried out on the Statement of Financial Position of the Sri Lankan Operation of the Bank (including Trading Book) on the change of interest rate right across the market in a hypothetical situation. The Bank could withstand this kind of impact arising out of sudden interest rate movement due to the availability of large Current Account and Savings (CASA) base and having a healthy asset and liability mix which could be re-priced. The sensitivity analysis factors in re-pricing terms on floating rate assets and liabilities to ensure rate shock reflects the correct moment in time that the relevant instrument will get impacted. The time horizon of the study is restricted to a 12 month period. The Bank undertakes varying degrees of such rate shocks and evaluates with the established limit structures to ensure that the risk exposures are within the risk appetite of the Bank as compared to the anticipated market rate movements.
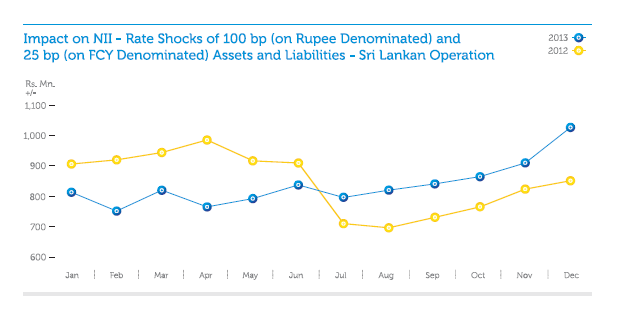
| 100 bp Parallel Increase/ Decrease (*) |
||
| Sensitivity to Projected Net Interest Income | 2013 | 2012 |
| Rs. Mn. | Rs. Mn. | |
| As at December 31, | +/- 1,027.93 | +/- 850.98 |
| Average for the year | +/- 836.99 | +/- 840.30 |
| Maximum for the year | +/- 1,027.93 | +/- 945.46 |
| Minimum for the year | +/- 751.33 | +/- 687.95 |
(*) Parallel increase in rates would have a positive impact on the earnings while a parallel decrease negatively affecting the earnings.
In arriving at the above results, the Bank considered items such as capital, reserves, bills payable, inter branch adjustments, staff loans, provisions and interest in suspense as rate non-sensitive. Similarly cash, current accounts, fixed assets too are considered to be non-rate sensitive.
(B) Exposure to Interest Rate Risk - Non-Trading Portfolio
Interest rate gap position of the non-trading portfolio of the Bank is given below:
Bank
| As at December 31, | Up to 3 months | 3 to 12 months | 1 to 3 years | 3 to 5 years | More than 5 years | Total as at 31.12.2013 |
| Rs. ’000 | Rs. ’000 | Rs. ’000 | Rs. ’000 | Rs. ’000 | Rs. ’000 | |
| Assets | ||||||
| Interest earning assets: | ||||||
| Cash and cash equivalents | 135,148 | – | – | – | – | 135,148 |
| Loans and receivables to banks | – | – | – | – | – | – |
| Loans and receivables to other customers | 178,953,027 | 60,786,281 | 115,479,366 | 43,096,409 | 20,644,592 | 418,959,675 |
| Financial investments - Available-for-sale | 33,508,356 | 67,404,741 | 8,962,927 | 10,828,935 | 2,994,403 | 123,699,362 |
| Total interest earning assets as at December 31, 2013 | 212,596,531 | 128,191,022 | 124,442,293 | 53,925,344 | 23,638,995 | 542,794,185 |
| Liabilities | ||||||
| Interest bearing liabilities: | ||||||
| Due to banks | 9,575,006 | 2,620,000 | – | – | – | 12,195,006 |
| Due to other customers | 268,795,021 | 124,398,156 | 8,158,766 | 6,461,491 | 7,568,542 | 415,381,976 |
| Debt securities issued | – | – | – | – | – | – |
| Subordinated liabilities | 132,385 | 126,802 | 972,660 | – | 9,825,000 | 11,056,847 |
| Total Interest bearing liabilities as at December 31, 2013 | 278,502,412 | 127,144,958 | 9,131,426 | 6,461,491 | 17,393,542 | 438,633,829 |
| (65,905,881) | 1,046,064 | 115,310,867 | 47,463,853 | 6,245,453 | 104,160,356 |
| As at December 31, | Up to 3 months | 3 to 12 months | 1 to 3 years | 3 to 5 years | More than 5 years | Total as at 31.12.2012 |
| Rs. ’000 | Rs. ’000 | Rs. ’000 | Rs. ’000 | Rs. ’000 | Rs. ’000 | |
| Assets | ||||||
| Interest earning assets: | ||||||
| Cash and cash equivalents | 5,169,379 | 126,486 | – | – | – | 5,295,865 |
| Loans and receivables to banks | – | 95,000 | – | – | – | 95,000 |
| Loans and receivables to other customers | 156,622,403 | 67,596,689 | 98,596,707 | 33,821,496 | 16,277,786 | 372,915,081 |
| Financial investments - Available-for-sale | 23,233,313 | 20,980,372 | 9,965,095 | 2,417,398 | 1,327,596 | 57,923,774 |
| Total interest earning assets as at December 31, 2012 | 185,025,095 | 88,798,547 | 108,561,802 | 36,238,894 | 17,605,382 | 436,229,720 |
| Liabilities | ||||||
| Interest bearing liabilities: | ||||||
| Due to banks | 1,354,651 | – | – | – | – | 1,354,651 |
| Due to other customers | 240,404,347 | 99,316,446 | 5,906,406 | 5,837,521 | 7,083,119 | 358,547,839 |
| Debt securities issued | – | – | – | – | – | – |
| Subordinated liabilities | 132,806 | 550 | – | 972,660 | – | 1,106,016 |
| Total Interest bearing liabilities as at December 31, 2012 | 241,891,804 | 99,316,996 | 5,906,406 | 6,810,181 | 7,083,119 | 361,008,506 |
| (56,866,709) | (10,518,449) | 102,655,396 | 29,428,713 | 10,522,263 | 75,221,214 |
(C) Foreign Exchange Risk
Foreign Exchange Risk of the Bank arising out of Net Open Position (NOP) of foreign currency denominated assets and liabilities is evaluated against thresholds established according to the risk appetite of the Bank after carrying out sensitivity analysis of change in 1% of US $ rate as depicted below:
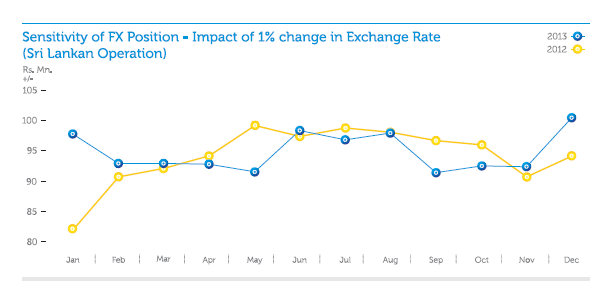
The Bank is in the process of embracing VaR computations for Fixed Income, Foreign Exchange Position and Equities with the implementation of the market risk software solution to embed more robust risk assessment in quantifying and predicting with the ultimate objective of estimating Economic Capital required for absorbing unexpected losses over a certain time horizon at a given confidence interval.
Liquidity Risk
As a financial intermediary, it is important for the Bank to manage liquidity risk on a day-to-day basis through a robust reporting and limit monitoring framework. In addition to the daily limit monitoring and Management Information System supported decision-making process, the Bank makes use of rigorous stress testing to evaluate its resilience to potential liquidity stress scenarios to facilitate proactive decision-making with a view to avoiding unforeseen adverse surprises in relation to liquidity. Contingency funding plans are in place to facilitate smooth functioning of the banking operation even in an unlikely event of a severe liquidity constraint.
Maturity Analysis of the Bank (Please refer Note 50 on Maturity Analysis).
Capital Management
Capital is a scarce resource for any organisation. For a bank, it has a more broad meaning as capital restricts the expansion of the business unlike any other commercial organisation. The worldwide accepted parameter for measurement of capital is the Capital Adequacy Ratio (CAR) calculated based on Guidelines issued by the Basel Committee.
Historically the Bank has been maintaining a relatively higher CAR when compared to other commercial banks. The unhindered growth of the Bank partly would have contributed to the higher level of capital maintained by the Bank. Further, the Bank deliberately maintains part of the capital in US $ to mitigate the adverse impact of depreciation of the local currency as well as to facilitate the overseas expansion plans.
The Bank has a well structured Corporate Planning and Budgeting procedure. Large capital budgeting decisions are arrived at after evaluating the impact of such decisions on the capital position of the Bank.
The Bank always strives to achieve an optimum balance between Tier I and Tier II capital. In 2013, the Bank raised a subordinated liability of US $ 75.0 Mn. from IFC which would qualify to be treated under Tier II capital of the Bank. Due to the above mentioned efforts, the Bank was able to maintain a CAR of approximately 17%, one of the highest in the banking industry in Sri Lanka today.
| BANK | ||
| 2013 | 2012 | |
| Rs. ’000 | Rs. ’000 | |
| Computation of Capital Base | ||
| Tier I: Core Capital | ||
| Paid-up ordinary shares/common stock/assigned capital | 19,586,813 | 18,008,797 |
| Statutory reserve fund | 3,768,094 | 3,245,819 |
| General and other reserves/published retained profits/(accumulated losses) | 28,595,196 | 24,311,605 |
| Less: | ||
| Other intangible assets | (467,594) | (497,038) |
| Advances granted to employees of the Bank for the purchase of shares of the Bank | (1,122) | (1,548) |
| 50% investments in the capital of other banks and financial institutions | (402) | (402) |
| Total eligible core capital (Tier I Capital) | 51,480,986 | 45,067,233 |
| Tier II: Supplementary capital | ||
| Revaluation reserves (as approved by CBSL) | 2,034,231 | 2,034,231 |
| General provisions | 1,656,465 | 1,500,098 |
| Approved subordinated term debt | 10,408,596 | 778,238 |
| Less: | ||
| 50% investments in the capital of other banks and financial institutions | (402) | (402) |
| Eligible supplementary capital (Tier II capital) | 14,098,890 | 4,312,165 |
| Total capital base | 65,579,876 | 49,379,398 |
| Computation of Ratios | ||
| Total risk-weighted assets (RWA) | ||
| Total risk-weighted assets for credit risk | 341,584,473 | 318,906,288 |
| Total risk-weighted assets market risk | 5,312,861 | 3,082,784 |
| Total risk-weighted assets operational risk | 40,989,114 | 34,629,967 |
| Sub total | 387,886,447 | 356,619,039 |
| Minimum Capital Charge | ||
| Minimum capital charge for credit risk | 34,158,447 | 31,890,629 |
| Minimum capital charge for market risk | 531,286 | 308,278 |
| Minimum capital charge for operational risk | 4,098,911 | 3,462,997 |
| Sub total | 38,788,645 | 35,661,904 |
| Total Capital Available to Meet the Capital Charge for Credit Risk | ||
| Total eligible core capital (Tier I capital) | 51,480,986 | 45,067,233 |
| Total eligible supplementary capital (Tier II capital) | 14,098,890 | 4,312,165 |
| Total capital base | 65,579,876 | 49,379,398 |
| Core Capital Ratio (minimum requirement 5%) | ||
| Total eligible core capital (Tier I capital) | 51,480,986 | 45,067,233 |
| Total risk-weighted assets | 387,886,447 | 356,619,038 |
| 13.27% | 12.64% | |
| Total Capital Ratio (minimum requirement 10%) | ||
| Total capital base | 65,579,876 | 49,379,398 |
| Total risk-weighted assets | 387,886,447 | 356,619,039 |
| 16.91% | 13.85% | |
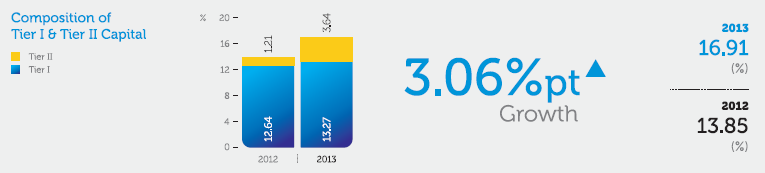
Fair values of Financial Assets not carried at fair value
Treatment for fair value of financial assets not carried at fair value is given in the Note 19.1.
57. Non-Cash Items Included in Profit Before Tax
| GROUP | BANK | |||
| 2013 | 2012 | 2013 | 2012 | |
| Rs. ’000 | Rs. ’000 | Rs. ’000 | Rs. ’000 | |
| Depreciation of property, plant & equipment | 717,583 | 942,765 | 786,024 | 859,675 |
| Amortisation of leasehold property | 1,452 | 1,452 | 942 | 942 |
| Amortisation of intangible assets | 149,347 | 174,104 | 149,291 | 174,055 |
| Impairment losses on loans and advances | 4,600,332 | 3,158,291 | 4,600,332 | 3,158,291 |
| Other impairment | – | – | 26,993 | 38,469 |
| Contributions to defined benefit plans - Unfunded schemes | 165,791 | 228,793 | 160,113 | 224,390 |
| Exchange rate variances on property, plant & equipment | (9,091) | (26,675) | (7,607) | (23,939) |
| Exchange rate variances on intangible assets | (1,011) | (2,794) | (397) | (1,646) |
| Exchange rate variances on defined benefit plans | 7,294 | 9,509 | 7,294 | 9,509 |
| Exchange rate variances on associates | – | (23) | – | – |
| Total | 5,631,697 | 4,485,422 | 5,722,985 | 4,439,746 |
58. Change in Operating Assets
| GROUP | BANK | |||
| 2013 | 2012 | 2013 | 2012 | |
| Rs. ’000 | Rs. ’000 | Rs. ’000 | Rs. ’000 | |
| Net (increase)/decrease in derivative financial instruments | (513,401) | 1,311,483 | (513,401) | 1,311,483 |
| Net (increase)/decrease in balances with Central Banks | 263,897 | 825,080 | 263,897 | 825,080 |
| Net (increase)/decrease in placements with banks | (12,031,156) | 4,488,607 | (12,031,156) | 4,488,607 |
| Net (increase)/decrease in other financial assets held-for-trading | 337,948 | (376,900) | 337,948 | (376,900) |
| Net (increase)/decrease in loans and receivables to banks | (82,490) | 48,602 | (82,490) | 48,602 |
| Net (increase)/decrease in loans and receivables to customers | 49,661,215 | 62,160,479 | 49,618,931 | 62,059,254 |
| Net (increase)/decrease in financial investments available-for-sale | 64,205,998 | (4,071,639) | 64,205,998 | (4,071,639) |
| Net (increase)/decrease in other assets | 357,539 | 1,888,846 | 363,768 | 1,903,219 |
| Total | 102,199,550 | 66,274,558 | 102,163,495 | 66,187,706 |
59. Change in Operating Liabilities
| GROUP | BANK | |||
| 2013 | 2012 | 2013 | 2012 | |
| Rs. ’000 | Rs. ’000 | Rs. ’000 | Rs. ’000 | |
| Net increase/(decrease) in due to banks | 9,300,274 | (6,810,540) | 9,300,274 | (6,810,540) |
| Net increase/(decrease) in derivative financial instruments | 1,327,625 | (350,880) | 1,327,625 | (350,880) |
| Net increase/(decrease) in deposits from banks, customers and debt securities issued | 60,530,264 | 66,871,054 | 60,541,375 | 66,856,800 |
| Net increase/(decrease) in other borrowings | 6,561,938 | (1,889,060) | 6,590,356 | (1,889,943) |
| Net increase/(decrease) in other provisions | – | 1,874 | – | 1,874 |
| Net increase/(decrease) in other liabilities | (685,678) | 2,000,842 | (685,564) | 1,999,373 |
| Net increase/(decrease) in due to subsidiaries | – | – | (6,578) | (7,470) |
| Total | 77,034,423 | 59,823,290 | 77,067,488 | 59,799,214 |